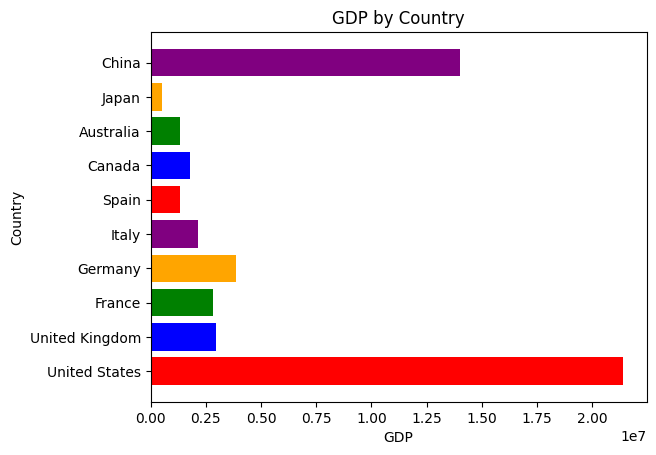
'Sure, I can help you with that! To create a horizontal bar chart of countries showing their GDP, we can use different colors for each bar. Would you like me to guide you through the process?'PandasAI는 널리 사용되는 데이터 분석 및 조작 도구인 Pandas에 생성형 인공지능 기능을 추가한 Python 라이브러리다. 이 라이브러리는 판다스와 함께 사용하도록 설계되었으나 판다스를 대체할 수는 없다. 이유는 판다스 문법에 맞는 파이썬 코드를 작성하는 용도에 적합하기 때문이다.
1 시각화
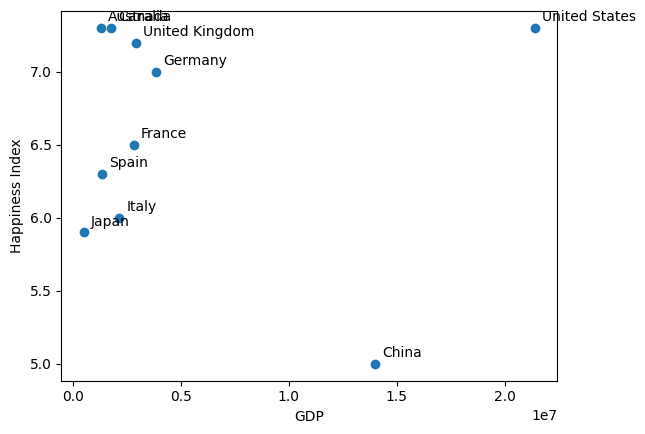
'Can you please create a scatter plot showing the relationship between GDP and happiness index, and label each point with the corresponding country name without overlapping?'2 코드 설정
코드
# Instantiate a LLM
from pandasai.llm.openai import OpenAI
llm = OpenAI(api_token=openai.api_key,
             model="gpt-3.5-turbo",
             temperature=0)

pandas_ai = PandasAI(llm)
pandas_ai.run(df, prompt='Which are the 5 happiest countries?')
'According to the data, the top 5 happiest countries are the United States, Canada, Australia, United Kingdom, and Germany.'
