1 출판 전자책
전자출판된 전자책은 다음 웹사이트에서 확인이 가능하다.
2 작업흐름
출판 책 목표를 세우고 chatGPT 각장의 절을 작성하여 deepl에서 교정 후 quarto book으로 출판한다. chatGPT가 책의 상당부분을 작성하지만 사실과 다른 사항이나 빠르게 발전하고 있는 R 데이터 과학 생태계 기술흐름을 반영하여 수정하는 것은 오로지 저자의 책임하에 이뤄져야만 한다.
- R 언어로 “데이터 과학” 4주 완성을 목표로 하는 책 집필 목표를 설정한다.
- chatGPT를 사용하여 목차를 생성한다.
- 지시명령어 공학(Prompt Engineering)을 사용해서 각 작을 작성한다.
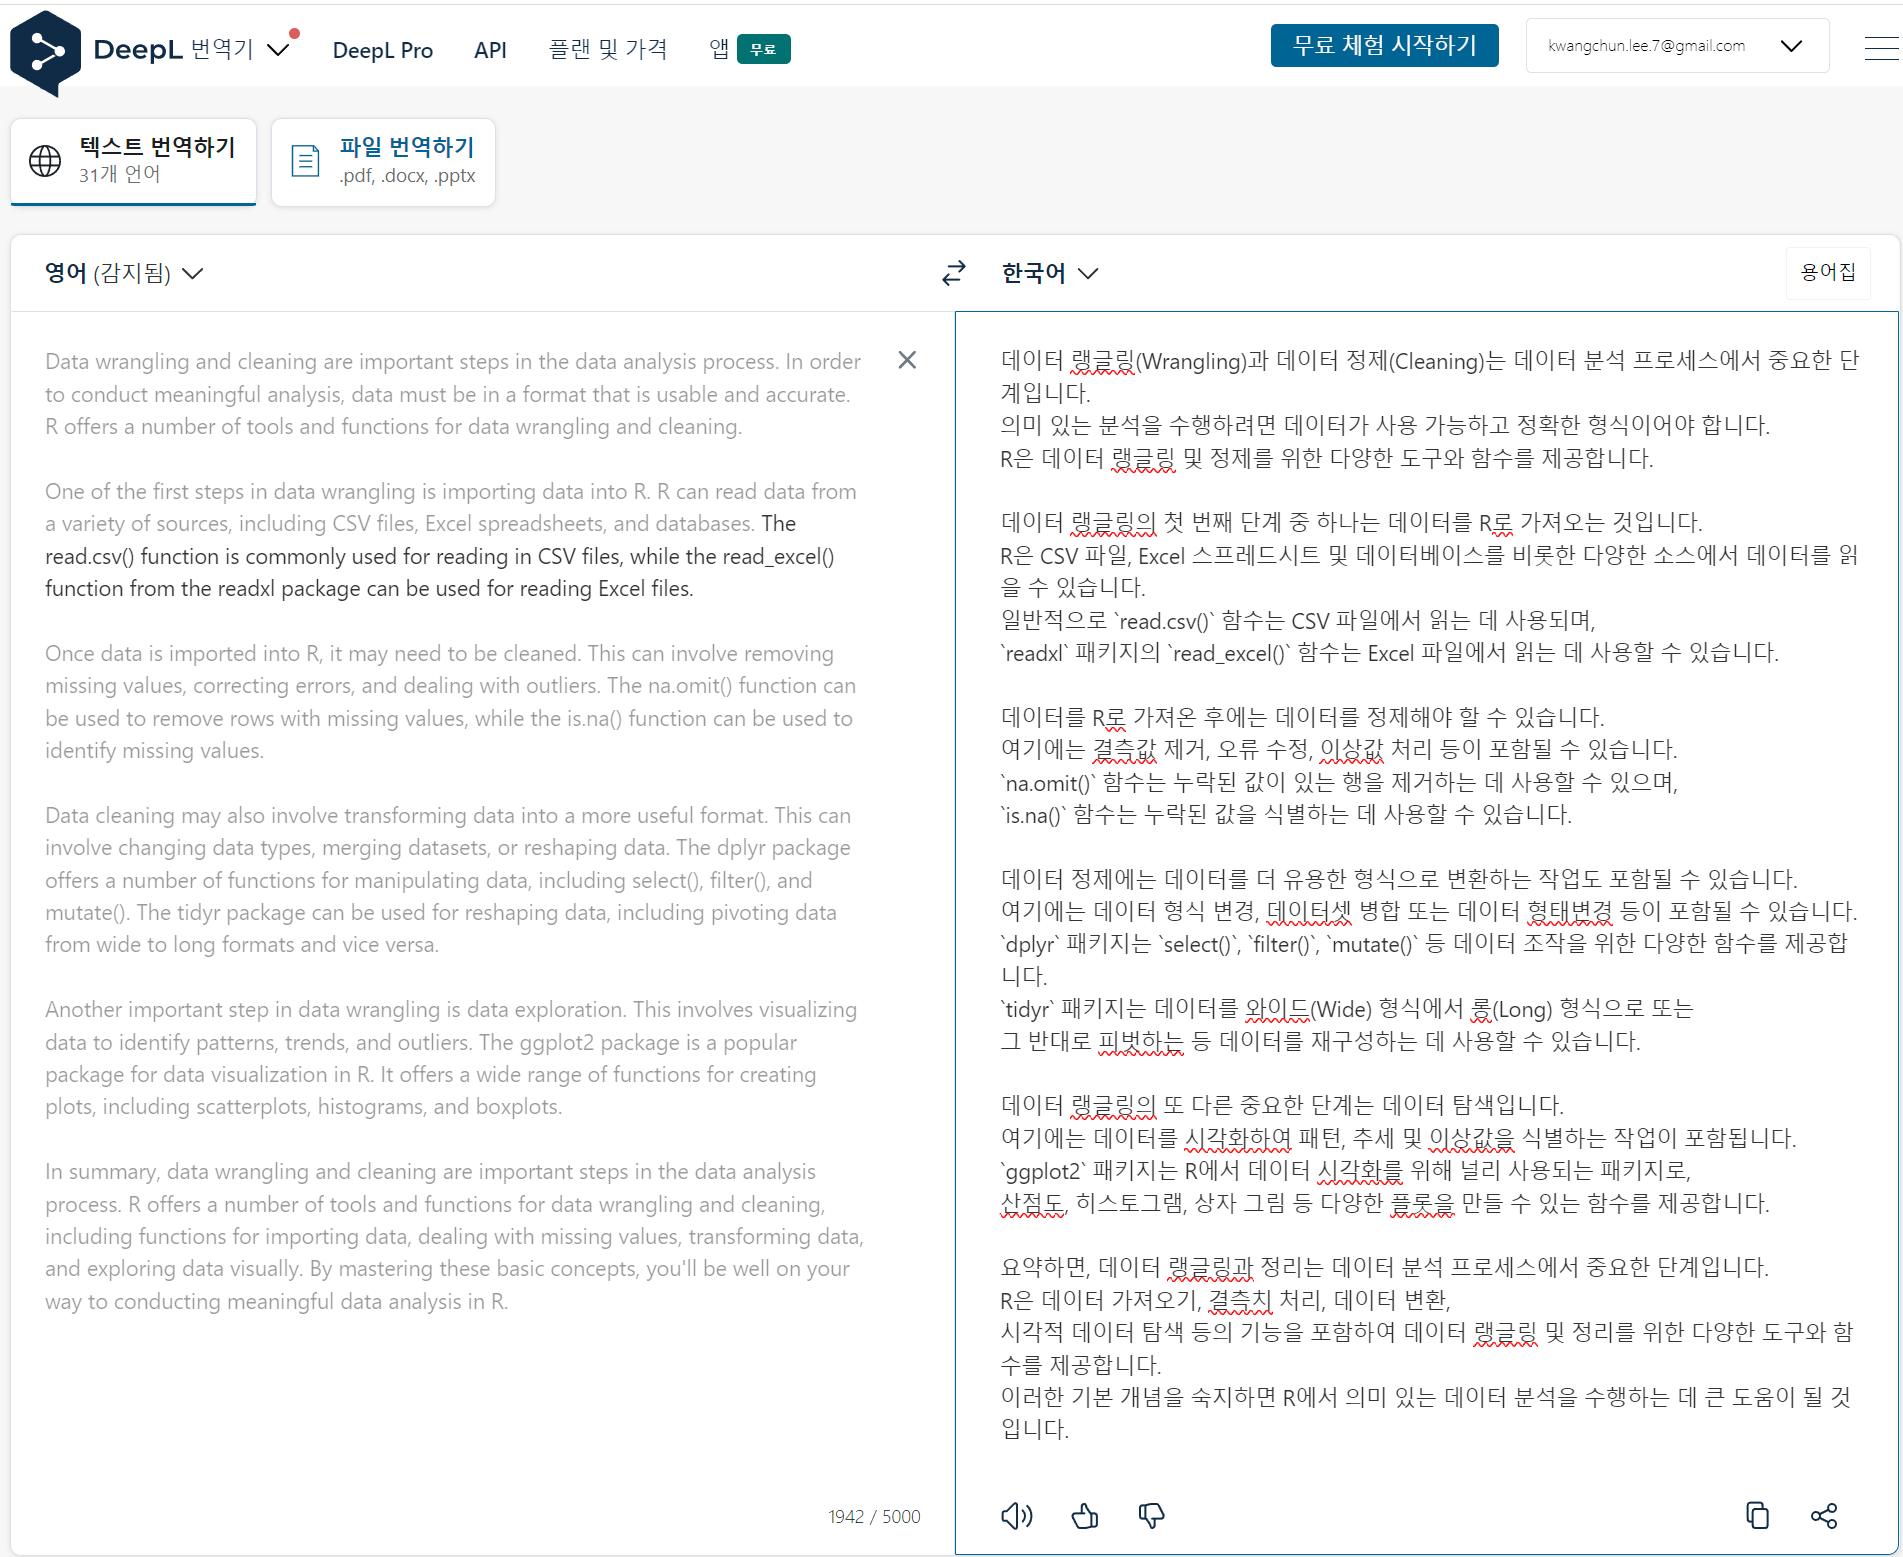
- DeepL 번역서비스를 사용해서 영어를 한글로 번역한다.
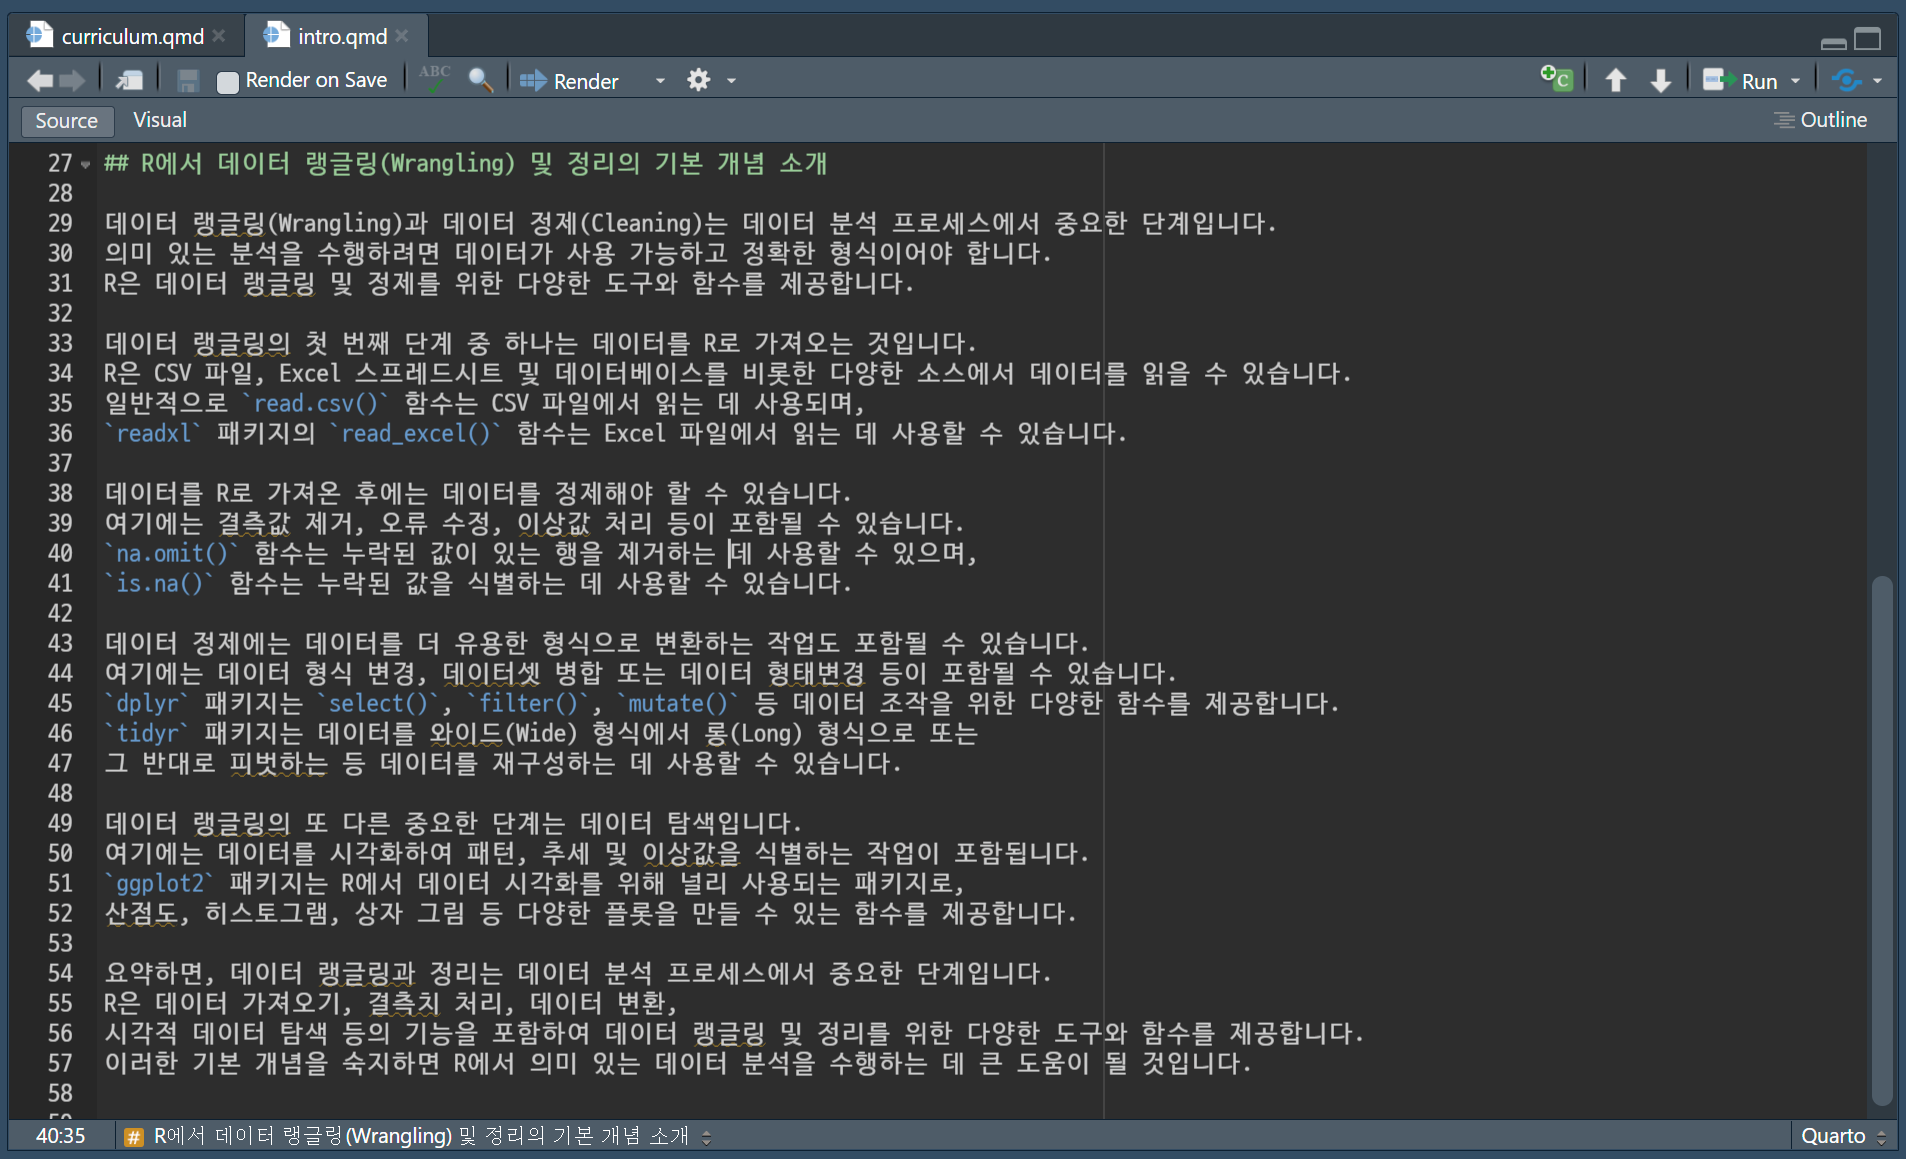
- Quarto Book 전자책 기능을 활용하여 전자책을 제작한다.
- GitHub Pages 기능을 활용하여 전자책을 출판한다.
2.1 작업흐름 상세
각 단계별 저작흐름에 주요하게 사용된 chatGPT, DeepL, Quarto Book 도구는 다음과 같이 사용되었다.
2.2 chatGPT 프롬프트
데이터 과학 책을 저작하기 위해 chatGPT에서 사용된 지시명령어(Prompt)는 다음과 같다. chatGPT 채팅 인터페이스를 사용해서 텍스트를 생성할 경우 Seed를 적용할 기능이 없기 때문에 비결정적(non-deterministic)이라 출력결과는 사뭇 다르게 된다.
write four weeks data science curriculum
Week 1: Introduction to Data Science and Data Wrangling
- Overview of data science and its importance in various fields
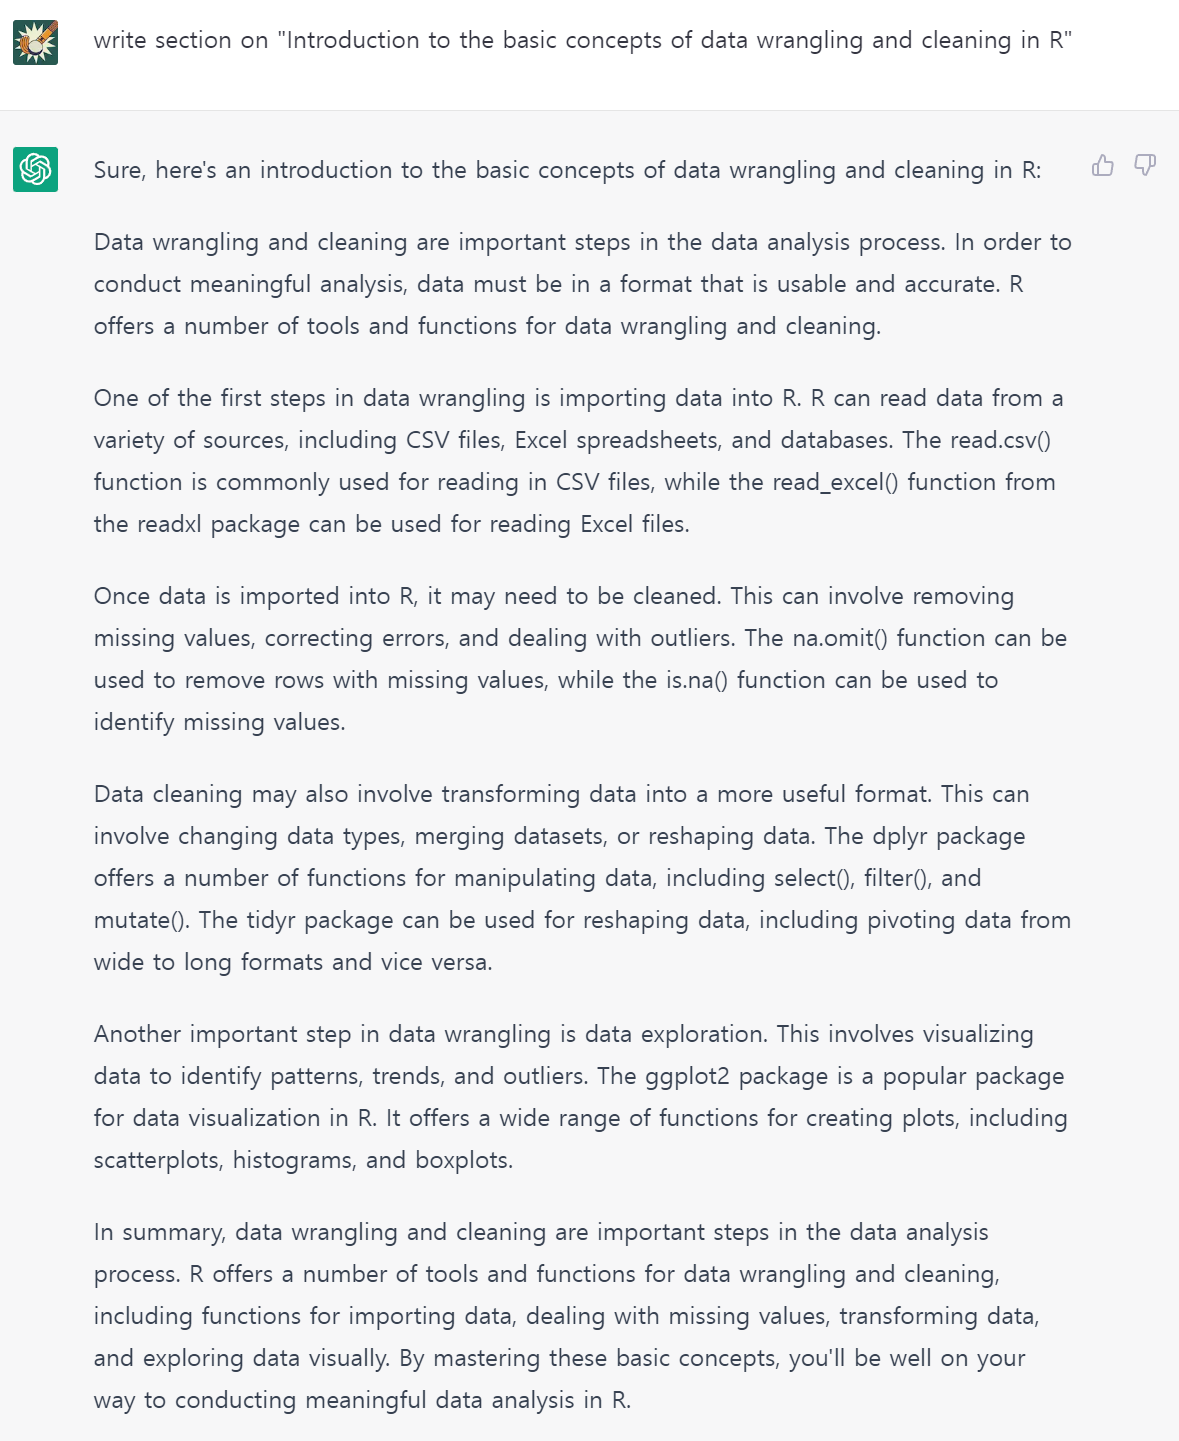
- Introduction to the basic concepts of data wrangling and cleaning
- Techniques for data wrangling such as filtering, sorting, merging, and aggregating data
- Use of Python libraries such as pandas for data wrangling
- Exercises and projects to practice data wrangling techniques
- Week 2: Data Visualization and Exploratory Data Analysis (EDA)
Week 2: Introduction to data visualization and its importance in data science
- Use of Python libraries such as matplotlib, seaborn and plotly for creating various types of visualizations
- Principles of EDA such as data distribution, correlation, and outliers detection
- Techniques for data exploration such as scatter plots, histograms, and box plots
- Exercises and projects to practice data visualization and EDA techniques
- Week 3: Statistical Analysis and Machine Learning Fundamentals
Week 3: Introduction to statistical analysis and machine learning
- Overview of basic statistical concepts such as probability distributions, hypothesis testing, and regression analysis
- Introduction to machine learning algorithms such as supervised and unsupervised learning, and their applications in data science
- Use of Python libraries such as scikit-learn for implementing machine learning algorithms
- Exercises and projects to practice statistical analysis and machine learning fundamentals Week 4: Advanced Data Science Techniques
Week 4: Introduction to advanced data science techniques such as deep learning, natural language processing, and computer vision
- Overview of deep learning concepts such as neural networks, convolutional neural networks (CNN), and recurrent neural networks (RNN)
- Use of Python libraries such as Tensorflow and Keras for implementing deep learning algorithms
- Introduction to natural language processing techniques such as sentiment analysis, text classification, and named entity recognition
- Introduction to computer vision techniques such as image classification, object detection, and segmentation
- Exercises and projects to practice advanced data science techniques
write data science curriculum with R
Week 1: Introduction to R and Data Wrangling
- Overview of R and its importance in data science
- Introduction to the basic concepts of data wrangling and cleaning in R
- Techniques for data wrangling such as filtering, sorting, merging, and aggregating data using dplyr and tidyr packages
- Introduction to data structures in R such as vectors, matrices, data frames, and lists
- Exercises and projects to practice data wrangling techniques in R
Week 2: Data Visualization and Exploratory Data Analysis (EDA)
- Introduction to data visualization and its importance in data science
- Use of R packages such as ggplot2 and lattice for creating various types of visualizations
- Principles of EDA such as data distribution, correlation, and outliers detection
- Techniques for data exploration such as scatter plots, histograms, and box plots
- Exercises and projects to practice data visualization and EDA techniques in R
Week 3: Statistical Analysis and Machine Learning Fundamentals
- Introduction to statistical analysis and machine learning in R
- Overview of basic statistical concepts such as probability distributions, hypothesis testing, and regression analysis
- Introduction to machine learning algorithms such as supervised and unsupervised learning, and their applications in data science
- Use of R packages such as caret and mlr for implementing machine learning algorithms
- Exercises and projects to practice statistical analysis and machine learning fundamentals in R
Week 4: Advanced Data Science Techniques
- Introduction to advanced data science techniques in R such as text mining, network analysis, and time series analysis
- Overview of text mining concepts such as sentiment analysis, text classification, and topic modeling using R packages such as tm and topicmodels
- Introduction to network analysis techniques such as social network analysis, centrality measures, and community detection using R packages such as igraph and statnet
- Introduction to time series analysis techniques such as ARIMA models, forecasting, and trend analysis using R packages such as forecast and tseries
- Exercises and projects to practice advanced data science techniques in R.
write section for "Overview of R and its importance in data science"
Sure, here’s an overview of R and its importance in data science:
R is a programming language and software environment for statistical computing and graphics. It was developed in the early 1990s by Ross Ihaka and Robert Gentleman at the University of Auckland, New Zealand. Since then, it has become one of the most popular languages for data analysis, visualization, and statistical modeling. R is open source, which means that it is freely available and can be modified by anyone.
R has a number of features that make it ideal for data science. For example, it has a large and active community of users who contribute to the development of packages for data analysis, visualization, and modeling. These packages are available for download from the Comprehensive R Archive Network (CRAN) and cover a wide range of topics, including machine learning, time series analysis, data visualization, and more.
Another advantage of R is its ability to handle large datasets. R has a number of packages that allow users to read in and manipulate data from various sources, including databases, spreadsheets, and text files. It also has powerful data manipulation capabilities, such as reshaping data, merging datasets, and aggregating data.
R is also widely used in academia and industry, particularly in fields such as finance, healthcare, and marketing. In academia, R is used in research and teaching in a variety of disciplines, including statistics, economics, and social sciences. In industry, R is used by companies for data analysis, modeling, and visualization, as well as for building data products.
Overall, R is an important tool in the data scientist’s toolbox, and its popularity continues to grow. It offers a wide range of capabilities for data analysis, visualization, and modeling, and has a large and active community of users and developers. If you’re interested in data science, learning R is definitely worth considering.
as an author of data science book, write a section on "Use of R packages such as tidymodels for implementing machine learning algorithms"
Section: Use of R Packages such as tidymodels for Implementing Machine Learning Algorithms
The process of building machine learning models involves several steps such as data preparation, model training, validation, and testing. In R, there are several packages available that can help data scientists to perform these steps with ease. One of the popular packages for implementing machine learning models is tidymodels.
tidymodels is an open-source collection of R packages designed for modeling and machine learning using the tidyverse style of programming. It provides a consistent framework for modeling that includes preprocessing, feature engineering, model tuning, and evaluation. Some of the important packages in tidymodels include:
- tidyverse: A collection of R packages for data wrangling, exploration, and visualization.
- dplyr: A package for data manipulation and transformation.
- tidyr: A package for data tidying and reshaping.
- ggplot2: A package for creating visualizations.
- caret: A package for building and evaluating machine learning models.
- rsample: A package for data splitting and resampling.
- parsnip: A package for model specification and tuning.
The tidymodels framework follows a consistent modeling pipeline, which includes the following steps:
- Data preparation: In this step, data is loaded and preprocessed using various techniques such as imputation, scaling, and encoding.
- Feature engineering: This step involves creating new features from existing ones, selecting important features, and transforming features to meet the requirements of the model.
- Model specification: In this step, a machine learning model is selected and defined. The parsnip package provides a consistent interface for specifying models.
- Model tuning: This step involves tuning the model’s hyperparameters to optimize performance. The tune package provides various methods for model tuning.
- Model evaluation: In this step, the model’s performance is evaluated using various metrics such as accuracy, precision, and recall. The yardstick package provides various metrics for model evaluation.
The tidymodels framework provides a simple and intuitive way of building machine learning models in R. With the help of various packages, it simplifies the process of data preparation, feature engineering, model specification, tuning, and evaluation. This framework can be useful for data scientists working on various types of data science problems, from classification and regression to clustering and association rule mining.
3 커리큘럼
데이터 과학 4주 과정 커리큘럼을 R, 파이썬언어로 학습할 경우 전체적으로 데이터 과학 핵심적 내용을 파악할 수 있다.
-
1주차 1주차: R 및 데이터 랭글링 소개
- R 개요 및 데이터 과학에서의 중요성
- R에서 데이터 랭글링(Wrangling) 및 정리의 기본 개념 소개
-
dplyr및tidyr패키지를 사용하여 데이터 필터링, 정렬, 병합 및 집계와 같은 데이터 랭글링 기법 소개 - 벡터, 행렬, 데이터 프레임 및 목록과 같은 R의 데이터 구조 소개
- R에서 데이터 랭글링 기술을 연습하는 연습 및 프로젝트
-
2주차 데이터 시각화 및 탐색적 데이터 분석(EDA)
- 데이터 시각화 소개 및 데이터 과학에서 데이터 시각화의 중요성
- 다양한 유형의 시각화를 생성하기 위한 ggplot2 및 lattice와 같은 R 패키지 사용
- 데이터 분포, 상관관계, 이상값 탐지 등 EDA의 원리 소개
- 분산형 차트, 히스토그램, 상자그림과 같은 데이터 탐색 기법
- R에서 데이터 시각화 및 EDA 기술을 연습할 수 있는 연습 및 프로젝트
-
3주차 통계 분석 및 기계 학습 기초
- R의 통계 분석 및 기계 학습 소개
- 확률 분포, 가설 테스트 및 회귀 분석과 같은 기본 통계 개념 개요
- 지도 학습 및 비지도 학습과 같은 기계 학습 알고리즘과 데이터 과학에서의 응용 프로그램 소개
- 머신 러닝 알고리즘 구현을 위한
caret및mlr과 같은 R 패키지 사용 - R에서 통계 분석 및 기계 학습 기본 사항을 연습하는 연습 및 프로젝트
-
4주차 고급 데이터 과학 기법
- 텍스트 마이닝, 네트워크 분석, 시계열 분석과 같은 R의 고급 데이터 과학 기법 소개
-
tm, 토픽모델 등 R 패키지를 활용한 감성 분석, 텍스트 분류, 토픽 모델링 등 텍스트 마이닝 개념 개요 소개 -
igraph,statnet등 R 패키지를 이용한 소셜 네트워크 분석, 중심성 측정, 커뮤니티 탐지 등 네트워크 분석 기법 소개 - 예측,
tseries등 R 패키지를 활용한 ARIMA 모델, 예측, 추세 분석 등 시계열 분석 기법 소개 - R의 고급 데이터 과학 기법을 실습할 수 있는 실습 및 프로젝트.
-
Week 1: Introduction to R and Data Wrangling
- Overview of R and its importance in data science
- Introduction to the basic concepts of data wrangling and cleaning in R
- Techniques for data wrangling such as filtering, sorting, merging, and aggregating data using dplyr and tidyr packages
- Introduction to data structures in R such as vectors, matrices, data frames, and lists
- Exercises and projects to practice data wrangling techniques in R
-
Week 2: Data Visualization and Exploratory Data Analysis (EDA)
- Introduction to data visualization and its importance in data science
- Use of R packages such as ggplot2 and lattice for creating various types of visualizations
- Principles of EDA such as data distribution, correlation, and outliers detection
- Techniques for data exploration such as scatter plots, histograms, and box plots
- Exercises and projects to practice data visualization and EDA techniques in R
-
Week 3: Statistical Analysis and Machine Learning Fundamentals
- Introduction to statistical analysis and machine learning in R
- Overview of basic statistical concepts such as probability distributions, hypothesis testing, and regression analysis
- Introduction to machine learning algorithms such as supervised and unsupervised learning, and their applications in data science
- Use of R packages such as caret and mlr for implementing machine learning algorithms
- Exercises and projects to practice statistical analysis and machine learning fundamentals in R
-
Week 4: Advanced Data Science Techniques
- Introduction to advanced data science techniques in R such as text mining, network analysis, and time series analysis
- Overview of text mining concepts such as sentiment analysis, text classification, and topic modeling using R packages such as tm and topicmodels
- Introduction to network analysis techniques such as social network analysis, centrality measures, and community detection using R packages such as igraph and statnet
- Introduction to time series analysis techniques such as ARIMA models, forecasting, and trend analysis using R packages such as forecast and tseries
- Exercises and projects to practice advanced data science techniques in R.
-
1주차: 데이터 과학 및 데이터 랭글링 소개
- 데이터 과학의 개요와 다양한 분야에서 데이터 과학의 중요성 소개
- 데이터 랭글링 및 정리의 기본 개념 소개
- 데이터 필터링, 정렬, 병합 및 집계와 같은 데이터 랭글링(Wrangling) 기술
- 데이터 랭글링을 위한 판다스(
pandas)와 같은 Python 라이브러리 사용 - 데이터 랭글링 기술을 연습할 수 있는 연습 및 프로젝트
-
2주차 데이터 시각화 및 탐색적 데이터 분석(EDA)
- 데이터 시각화에 대한 소개와 데이터 과학에서 데이터 시각화의 중요성
- 다양한 유형의 시각화를 생성하기 위해
matplotlib,seaborn,plotly와 같은 Python 라이브러리 사용 - 데이터 분포, 상관관계, 이상값 탐지 등 EDA의 원리 소개
- 분산형 차트, 히스토그램, 박스 플롯 등 데이터 탐색을 위한 기술
- 데이터 시각화 및 EDA 기술을 연습할 수 있는 연습 및 프로젝트
-
3주차 통계 분석 및 머신 러닝 기초
- 통계 분석 및 머신 러닝 소개
- 확률 분포, 가설 테스트 및 회귀 분석과 같은 기본 통계 개념 개요
- 지도 학습 및 비지도 학습과 같은 머신 러닝 알고리즘과 데이터 과학에 적용 소개
- 머신 러닝 알고리즘 구현을 위한
scikit-learn과 같은 Python 라이브러리 사용 - 통계 분석 및 머신 러닝 기초를 연습하는 연습 및 프로젝트
-
4주차 고급 데이터 과학 기법
- 딥러닝, 자연어 처리, 컴퓨터 비전과 같은 고급 데이터 과학 기법 소개
- 신경망, 컨볼루션 신경망(CNN), 순환 신경망(RNN)과 같은 딥 러닝 개념 개요
- 딥러닝 알고리즘 구현을 위한
Tensorflow및Keras와 같은 Python 라이브러리 사용 - 감정 분석, 텍스트 분류, 명명된 개체 인식과 같은 자연어 처리 기술 소개
- 이미지 분류, 객체 감지, 분할과 같은 컴퓨터 비전 기술 소개
- 고급 데이터 과학 기법을 실습할 수 있는 연습 및 프로젝트
-
Week 1: Introduction to Data Science and Data Wrangling
- Overview of data science and its importance in various fields
- Introduction to the basic concepts of data wrangling and cleaning
- Techniques for data wrangling such as filtering, sorting, merging, and aggregating data
- Use of Python libraries such as pandas for data wrangling
- Exercises and projects to practice data wrangling techniques
-
Week 2: Data Visualization and Exploratory Data Analysis (EDA)
- Introduction to data visualization and its importance in data science
- Use of Python libraries such as matplotlib, seaborn and plotly for creating various types of visualizations
- Principles of EDA such as data distribution, correlation, and outliers detection
- Techniques for data exploration such as scatter plots, histograms, and box plots
- Exercises and projects to practice data visualization and EDA techniques
-
Week 3: Statistical Analysis and Machine Learning Fundamentals
- Introduction to statistical analysis and machine learning
- Overview of basic statistical concepts such as probability distributions, hypothesis testing, and regression analysis
- Introduction to machine learning algorithms such as supervised and unsupervised learning, and their applications in data science
- Use of Python libraries such as scikit-learn for implementing machine learning algorithms
- Exercises and projects to practice statistical analysis and machine learning fundamentals
-
Week 4: Advanced Data Science Techniques
- Introduction to advanced data science techniques such as deep learning, natural language processing, and computer vision
- Overview of deep learning concepts such as neural networks, convolutional neural networks (CNN), and recurrent neural networks (RNN)
- Use of Python libraries such as Tensorflow and Keras for implementing deep learning algorithms
- Introduction to natural language processing techniques such as sentiment analysis, text classification, and named entity recognition
- Introduction to computer vision techniques such as image classification, object detection, and segmentation
- Exercises and projects to practice advanced data science techniques
3.1 수정된 커리큘럼
-
1주차 1주차: R 및 데이터 랭글링 소개
- R 개요 및 데이터 과학에서의 중요성
- R에서 데이터 랭글링(Wrangling) 및 정리의 기본 개념 소개
-
dplyr및tidyr패키지를 사용하여 데이터 필터링, 정렬, 병합 및 집계와 같은 데이터 랭글링 기법 소개 pivot_longer(),pivot_wider()함수 사용 깔끔한 데이터 변형- 벡터, 행렬, 데이터 프레임 및 목록과 같은 R의 데이터 구조 소개
- R에서 데이터 랭글링 기술을 연습하는 연습 및 프로젝트
-
2주차 데이터 시각화 및 탐색적 데이터 분석(EDA)
- 데이터 시각화 소개 및 데이터 과학에서 데이터 시각화의 중요성
- 다양한 유형의 시각화를 생성하기 위한
ggplot2,gtR 패키지 사용 - 데이터 분포, 상관관계, 이상값 탐지 등 EDA의 원리 소개
- 분산형 차트, 히스토그램, 상자그림과 같은 데이터 탐색 기법
- R에서 데이터 시각화 및 EDA 기술을 연습할 수 있는 연습 및 프로젝트
-
3주차 통계 분석 및 기계 학습 기초
- R의 통계 분석 및 기계 학습 소개
- 확률 분포, 가설 테스트 및 회귀 분석과 같은 기본 통계 개념 개요
- 지도 학습 및 비지도 학습과 같은 기계 학습 알고리즘과 데이터 과학에서의 응용 프로그램 소개
- 머신 러닝 알고리즘 구현을 위한
tidymodels및mlr과 같은 R 패키지 사용 - R에서 통계 분석 및 기계 학습 기본 사항을 연습하는 연습 및 프로젝트
-
4주차 고급 데이터 과학 기법
- 텍스트 마이닝, 네트워크 분석, 시계열 분석과 같은 R의 고급 데이터 과학 기법 소개
-
tidytext, 토픽모델 등 R 패키지를 활용한 감성 분석, 텍스트 분류, 토픽 모델링 등 텍스트 마이닝 개념 개요 소개 -
tidygraph등 R 패키지를 이용한 소셜 네트워크 분석, 중심성 측정, 커뮤니티 탐지 등 네트워크 분석 기법 소개 - 예측,
tidyverts등 R 패키지를 활용한 ARIMA 모델, 예측, 추세 분석 등 시계열 분석 기법 소개 - R의 고급 데이터 과학 기법을 실습할 수 있는 실습 및 프로젝트.