import requestsimport pandas as pd# URL of Samsung Electronics stock historical dataurl ="https://finance.naver.com/item/sise_day.naver?code=005930&page="# Empty list to store stock price datadata = []# Loop through the last 3 years of pages (60 pages in total)for page inrange(1, 61):# Send a GET request to the URL with the current page number response = requests.get(url +str(page))# Read the HTML table into a pandas dataframe df = pd.read_html(response.content)[0]# Drop the last row which is just a duplicate of the column headers df = df.drop(len(df) -1)# Append the dataframe to the list data.append(df)# Concatenate all dataframes into a single dataframedf = pd.concat(data)# Reverse the order of rows to start from the earliest datedf = df.iloc[::-1]# Set the date column as the index and remove unnecessary columnsdf = df.set_index('날짜')[['종가', '거래량']]# Convert the data types of columns to float and intdf['종가'] = df['종가'].astype(float)df['거래량'] = df['거래량'].str.replace(',', '').astype(int)# Print the resulting dataframeprint(df)
통상 영업일기준으로 1년을 보통 247일가 된다. 해당 웹사이트 삼성전자 주식 첫페이지를 일별하면 한 페이지에 10 영업일 주식거래 데이터가 담겨있어 총 약 반년치 데이터가 누락되어 2.5년 정도 된다고 보면 된다.
코드
import requestsimport pandas as pd# URL of Samsung Electronics stock historical dataurl ="https://finance.naver.com/item/sise_day.naver?code=005930&page="# Empty list to store stock price datadata = []# Loop through the last 3 years of pages (60 pages in total)for page inrange(1, 61):# Send a GET request to the URL with the current page number response = requests.get(url +str(page), headers={'User-agent': 'Mozilla/5.0'})# Check if the response is successfulif response.status_code ==200:# Read the HTML table into a pandas dataframe df_list = pd.read_html(response.text, flavor='html5lib')# Check if the list of dataframes is not emptyif df_list:# Get the first dataframe df = df_list[0]# Drop the last row which is just a duplicate of the column headers df = df.drop(len(df) -1)# Append the dataframe to the list data.append(df)# Concatenate all dataframes into a single dataframedf = pd.concat(data)# Reverse the order of rows to start from the earliest datedf = df.iloc[::-1]df = df.dropna()# Set the date column as the index and remove unnecessary columnsdf = df.set_index('날짜')[['종가', '거래량']]# Convert the data types of columns to float and intdf['종가'] = df['종가'].astype(float)df['거래량'] = df['거래량'].astype(int)# Save the dataframe as a CSV filedf.to_csv('data/samsung.csv')# Print a confirmation messageprint('samsung.csv saved successfully.')
import pandas as pdimport matplotlib.pyplot as plt# Load the Samsung Electronics stock price data from the 'data/samsung.csv' file into a pandas dataframedf = pd.read_csv('data/samsung.csv', index_col='날짜', parse_dates=True)# Create a time series graph with matplotlibplt.plot(df.index, df['종가'])# Set the x-axis label to 'Date'plt.xlabel('Date')# Set the y-axis label to 'Closing Price'plt.ylabel('Closing Price')# Set the title of the graph to 'Samsung Electronics Stock Price'plt.title('Samsung Electronics Stock Price')# Show the graphplt.show()# PNG 저장plt.savefig('images/samsung_matplotlib.png')
import pandas as pdimport pmdarima as pm# Load the Samsung Electronics stock price data from the 'data/samsung.csv' file into a pandas dataframedf = pd.read_csv('data/samsung.csv', index_col='날짜', parse_dates=True)# Extract the '종가' column as a pandas seriesclosing_prices = df['종가']# Create an ARIMA model using pmdarimamodel = pm.auto_arima(closing_prices, seasonal=False, error_action='ignore', suppress_warnings=True)# Make a prediction for the next 30 daysforecast = model.predict(n_periods=30)# Create a new column in the dataframe to store the predicted pricesdf['Predicted Price'] =None# Calculate the predicted prices for the next 30 dayslast_price = closing_prices[-1]for i inrange(30): predicted_price = last_price * (1+ forecast[i]) date = closing_prices.index[-1] + pd.DateOffset(days=i+1) df.at[date, 'Predicted Price'] = predicted_price# Print the dataframe with the predicted pricesprint(df)
시계열 ARIMA 예측 기반 코드를 제공하지만 실제로 돌려보면 오류가 있어 사람이 손을 봐야 함.
코드
import pandas as pdimport pmdarima as pm# Load the Samsung Electronics stock price data from the 'data/samsung.csv' file into a pandas dataframedata = pd.read_csv('data/samsung.csv', index_col='날짜', parse_dates=True)# Extract the '종가' column and leave it as dataframeclosing_prices = data[['종가']]# Create an ARIMA model using pmdarimastepwise_model = pm.auto_arima(closing_prices, start_p=1, start_q=1, max_p=3, max_q=3, m=12, start_P=0, seasonal=True, d=1, D=1, trace=True, error_action='ignore', suppress_warnings=True, stepwise=True)print(stepwise_model.aic())# data.index.min(), # data.index.max()# Make a prediction for the next 30 daysfuture_dates = pd.date_range(start='2023-03-15', end='2023-04-14')future_forecast = stepwise_model.predict(n_periods =len(future_dates))# Create a DataFrame of forecasted values with future dates as the indexforecast_df = pd.DataFrame({'종가': future_forecast,'날짜': future_dates})forecast_df.set_index('날짜', inplace=True)# Print the forecasted valuesfull_df = pd.concat([closing_prices, forecast_df], axis =0)print(full_df)full_df.to_csv("data/samsung_forecast.csv")
chatGPT가 제시한 코드를 기반으로 자료형을 맞춰 예측값과 결합시켜 예측값의 정확도를 평가할 수 있도록 로컬파일로 떨어뜨림.
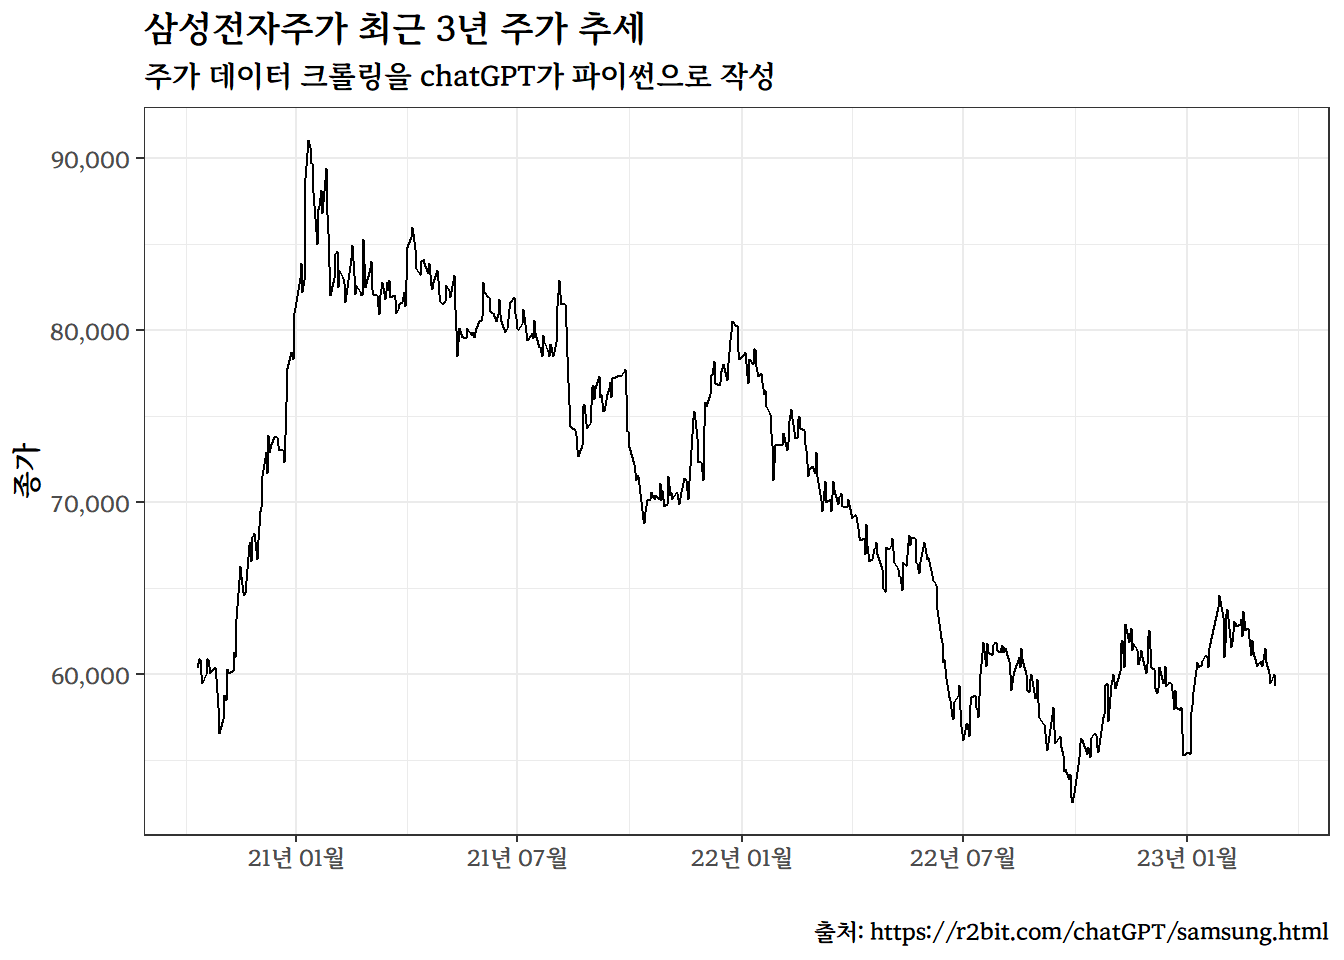
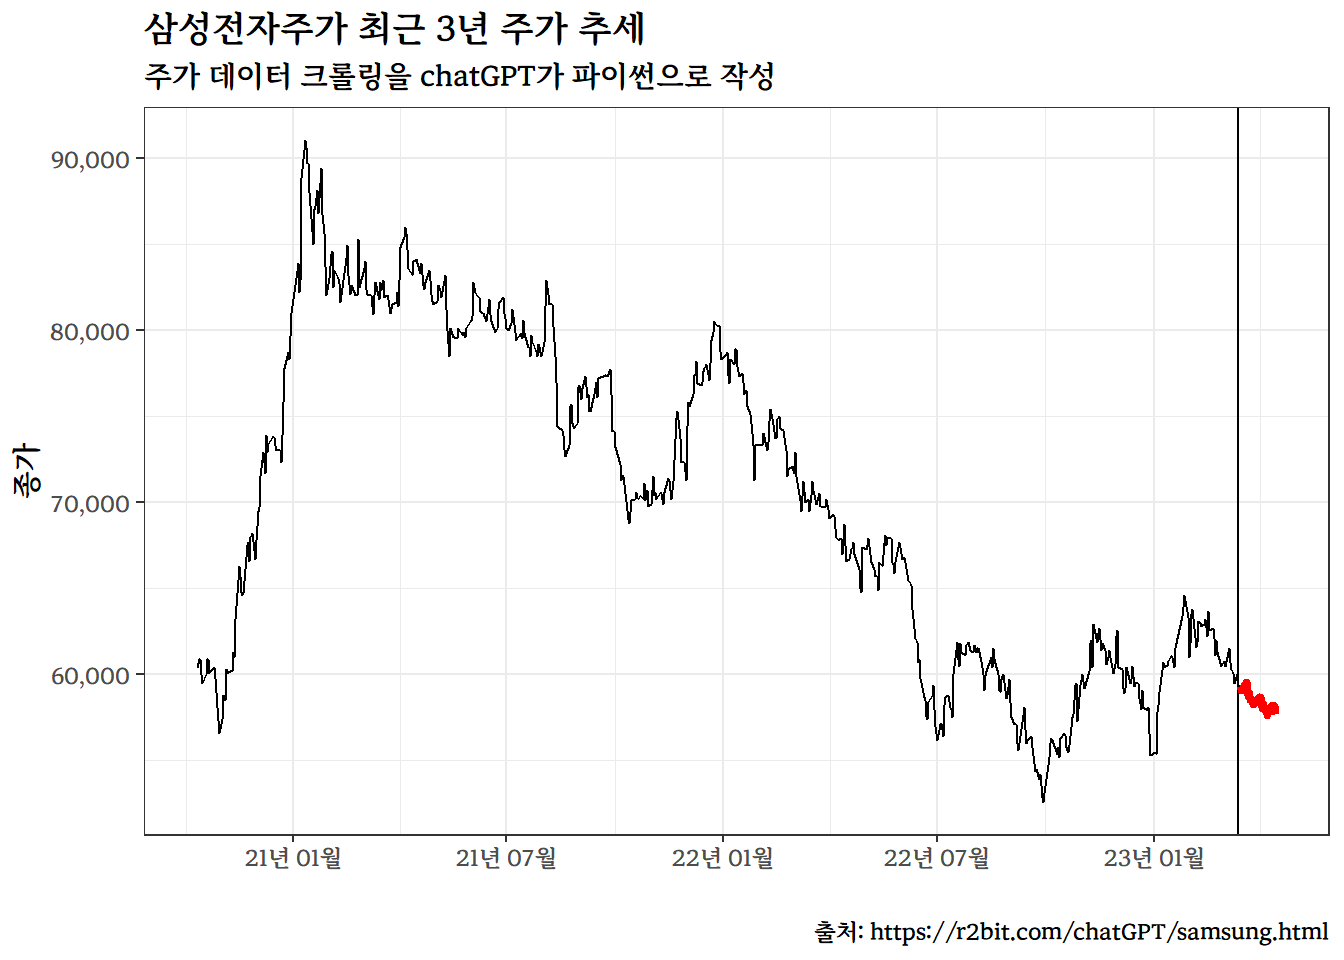
library(tidyverse)full_tbl<-read_csv("data/samsung_forecast.csv")%>%## 자료형 변환 -----------mutate(날짜 =lubridate::ymd(날짜))future_data<-full_tbl%>%filter(날짜>=as.Date("2023-03-15"))full_tbl%>%## 자료형 변환 -----------mutate(날짜 =lubridate::ymd(날짜))%>%ggplot(aes(x =날짜, y =종가))+geom_line(color="black")+scale_x_date(date_labels ="%y년 %m월")+scale_y_continuous(labels =scales::comma)+theme_bw(base_family ="MaruBuri Bold")+labs(x ="", title ="삼성전자주가 최근 3년 주가 추세", subtitle ="주가 데이터 크롤링을 chatGPT가 파이썬으로 작성", caption ="출처: https://r2bit.com/chatGPT/samsung.html")+geom_vline(xintercept =as.Date("2023-03-14"))+geom_line(data =future_data, aes(x=날짜, y=종가), color ="red", size =1.5)
---title: "chatGPT"subtitle: "삼성전자 주가예측"description: | `chatGPT` 코딩 기능을 활용하여 주가를 예측해보자.author: - name: 이광춘 url: https://www.linkedin.com/in/kwangchunlee/ affiliation: 한국 R 사용자회 affiliation-url: https://github.com/bit2rtitle-block-banner: true#title-block-banner: "#562457"format: html: css: css/quarto.css theme: flatly code-fold: true toc: true toc-depth: 3 toc-title: 목차 number-sections: true highlight-style: github self-contained: falsefilters: - lightbox - line-highlight lightbox: autolink-citations: yesknitr: opts_chunk: message: false warning: false collapse: true comment: "#>" R.options: knitr.graphics.auto_pdf: trueeditor_options: chunk_output_type: consoleeditor: markdown: wrap: 72---삼성전자 주가를 예측하는 프로그램을 OpenAI chatGPT를 활용하여 작성해보자.# 데이터 크롤링삼성전자 주가를 예측하기 위해서는 데이터가 필요하다. 이를 위해서 다음과 같이 지시명령어(prompt)를 작성하여 `chatGPT`에 요청한다.:::{.callout-warning collapse="false"}### 지시명령어> 파이썬으로 최근 3년간 삼성전자 주가 데이터를 크롤링하여 samsung.csv 파일로 저장하는 코드를 작성해 주세요.:::[**대한민국 영업일수** 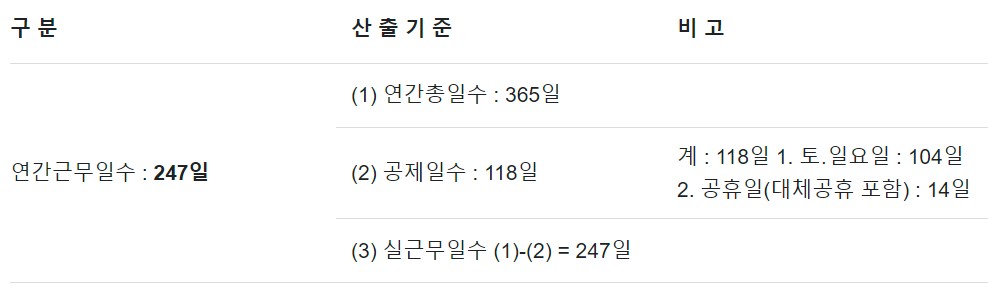]{.aside}:::{.panel-tabset}## chatGPT 코드 {.unnumbered}```{python}#| eval: falseimport requestsimport pandas as pd# URL of Samsung Electronics stock historical dataurl ="https://finance.naver.com/item/sise_day.naver?code=005930&page="# Empty list to store stock price datadata = []# Loop through the last 3 years of pages (60 pages in total)for page inrange(1, 61):# Send a GET request to the URL with the current page number response = requests.get(url +str(page))# Read the HTML table into a pandas dataframe df = pd.read_html(response.content)[0]# Drop the last row which is just a duplicate of the column headers df = df.drop(len(df) -1)# Append the dataframe to the list data.append(df)# Concatenate all dataframes into a single dataframedf = pd.concat(data)# Reverse the order of rows to start from the earliest datedf = df.iloc[::-1]# Set the date column as the index and remove unnecessary columnsdf = df.set_index('날짜')[['종가', '거래량']]# Convert the data types of columns to float and intdf['종가'] = df['종가'].astype(float)df['거래량'] = df['거래량'].str.replace(',', '').astype(int)# Print the resulting dataframeprint(df)```통상 영업일기준으로 1년을 보통 247일가 된다. 해당 웹사이트 [삼성전자 주식 첫페이지](https://finance.naver.com/item/sise_day.naver?code=005930&page=1)를 일별하면한 페이지에 10 영업일 주식거래 데이터가 담겨있어 총 약 반년치 데이터가 누락되어 2.5년 정도 된다고 보면 된다.## 오류 수정코드 {.unnumbered}```{python}#| eval: false#| code-line-numbers: true#| source-line-numbers: "14,46,39,49"import requestsimport pandas as pd# URL of Samsung Electronics stock historical dataurl ="https://finance.naver.com/item/sise_day.naver?code=005930&page="# Empty list to store stock price datadata = []# Loop through the last 3 years of pages (60 pages in total)for page inrange(1, 61):# Send a GET request to the URL with the current page number response = requests.get(url +str(page), headers={'User-agent': 'Mozilla/5.0'})# Check if the response is successfulif response.status_code ==200:# Read the HTML table into a pandas dataframe df_list = pd.read_html(response.text, flavor='html5lib')# Check if the list of dataframes is not emptyif df_list:# Get the first dataframe df = df_list[0]# Drop the last row which is just a duplicate of the column headers df = df.drop(len(df) -1)# Append the dataframe to the list data.append(df)# Concatenate all dataframes into a single dataframedf = pd.concat(data)# Reverse the order of rows to start from the earliest datedf = df.iloc[::-1]df = df.dropna()# Set the date column as the index and remove unnecessary columnsdf = df.set_index('날짜')[['종가', '거래량']]# Convert the data types of columns to float and intdf['종가'] = df['종가'].astype(float)df['거래량'] = df['거래량'].astype(int)# Save the dataframe as a CSV filedf.to_csv('data/samsung.csv')# Print a confirmation messageprint('samsung.csv saved successfully.')```네이버 주식 일별시세를 읽어오는 경우 `ValueError: No tables found`가 발생되어 [네이버 주식 일별 시세 pandas read_html() ValueError: No tables found 오류](https://dasom.net/147) 참조하여 오류수정, 크롤링 데이터에 결측값이 포함되어 이를 수정작업 후에ㅏ 마지막으로 자료형 오류수정 후 데이터를 `data/samsung.csv` 파일로 다운로드하여 작업마무리한다.:::## 오류 수정`lxml` 패키지가 설치되지 않는 오류가 발생되었다.```ImportError: lxml not found, please install itValueError: No objects to concatenate```:::{.callout-warning collapse="false"}### 지시명령어> fix the bug <br>> ImportError: lxml not found, please install it <br>> ValueError: No objects to concatenate <br>> Answer in Korean.`pip install lxml`:::# 시각화앞서 크롤링하여 `.csv` 파일로 저장한 데이터를 `pandas` 데이터프레임 자료구조와시각화를 위해서 `matplotlib`으로 시각화하는 코드를 작성하게 지시한다.:::{.callout-warning collapse="false"}## 지시명령어> 삼성전자 주가데이터가 'data/samsung.csv' 파일에 저장되어 있습니다. pandas 데이터프레임으로 불러읽어와서 x 축에는 '날짜' y축에는 '종가'로 하여 시계열 그래프를 matplotlib으로 작성해주세요::::::{.panel-tabset}## chatGPT 파이썬 코드 {.unumbered}```{python}#| eval: falseimport pandas as pdimport matplotlib.pyplot as plt# Load the Samsung Electronics stock price data from the 'data/samsung.csv' file into a pandas dataframedf = pd.read_csv('data/samsung.csv', index_col='날짜', parse_dates=True)# Create a time series graph with matplotlibplt.plot(df.index, df['종가'])# Set the x-axis label to 'Date'plt.xlabel('Date')# Set the y-axis label to 'Closing Price'plt.ylabel('Closing Price')# Set the title of the graph to 'Samsung Electronics Stock Price'plt.title('Samsung Electronics Stock Price')# Show the graphplt.show()# PNG 저장plt.savefig('images/samsung_matplotlib.png')```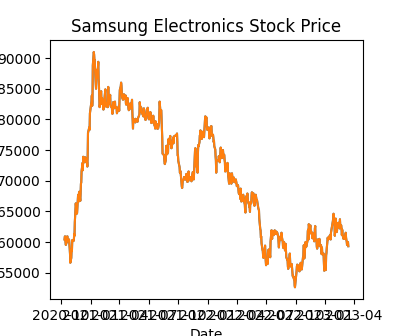## 사람작성 R 코드 {.unumbered}```{r}library(tidyverse)extrafont::loadfonts()samsung_tbl <-read_csv("data/samsung.csv")samsung_tbl %>%## 자료형 변환 -----------mutate(날짜 = lubridate::ymd(날짜)) %>%ggplot(aes(x = 날짜, y = 종가)) +geom_line() +scale_x_date(date_labels ="%y년 %m월") +scale_y_continuous(labels = scales::comma) +theme_bw(base_family ="MaruBuri Bold") +labs(x ="",title ="삼성전자주가 최근 3년 주가 추세",subtitle ="주가 데이터 크롤링을 chatGPT가 파이썬으로 작성",caption ="출처: https://r2bit.com/chatGPT/samsung.html")```:::# 예측데이터에 대한 전반적인 사항은 파악을 했으니 다음 단계로 삼성전자 주가 예측을 통해서 투자수익을 거둘 수 있는 방안을 찾아보자. chatGPT에 과거 3년치 삼성전자 주가 데이터를 바탕으로 1달 예측하는 코드를 작성하게 지시한다.:::{.callout-warning collapse="false"}## 지시명령어> 삼성전자 주가 종가기준 1달 예측하는 모형을 제작하고 예측값을 pandas 데이터프레임에 붙여줘 <br>> 선형 회귀모형 대신 ARIMA 모형으로 예측모형을 바꿔서 다시 작성해줘 <br>> 삼성전자 주가를 예측하는데 pmdarima 패키지를 사용해서 1달 예측하는 코드를 작성해주세요. ::::::{.panel-tabset}## chatGPT 파이썬 코드 {.unumbered}```{python}#| eval: falseimport pandas as pdimport pmdarima as pm# Load the Samsung Electronics stock price data from the 'data/samsung.csv' file into a pandas dataframedf = pd.read_csv('data/samsung.csv', index_col='날짜', parse_dates=True)# Extract the '종가' column as a pandas seriesclosing_prices = df['종가']# Create an ARIMA model using pmdarimamodel = pm.auto_arima(closing_prices, seasonal=False, error_action='ignore', suppress_warnings=True)# Make a prediction for the next 30 daysforecast = model.predict(n_periods=30)# Create a new column in the dataframe to store the predicted pricesdf['Predicted Price'] =None# Calculate the predicted prices for the next 30 dayslast_price = closing_prices[-1]for i inrange(30): predicted_price = last_price * (1+ forecast[i]) date = closing_prices.index[-1] + pd.DateOffset(days=i+1) df.at[date, 'Predicted Price'] = predicted_price# Print the dataframe with the predicted pricesprint(df)```시계열 ARIMA 예측 기반 코드를 제공하지만 실제로 돌려보면 오류가 있어 사람이 손을 봐야 함.## 사람 작성 코드 {.unnumbered}```{python}#| eval: falseimport pandas as pdimport pmdarima as pm# Load the Samsung Electronics stock price data from the 'data/samsung.csv' file into a pandas dataframedata = pd.read_csv('data/samsung.csv', index_col='날짜', parse_dates=True)# Extract the '종가' column and leave it as dataframeclosing_prices = data[['종가']]# Create an ARIMA model using pmdarimastepwise_model = pm.auto_arima(closing_prices, start_p=1, start_q=1, max_p=3, max_q=3, m=12, start_P=0, seasonal=True, d=1, D=1, trace=True, error_action='ignore', suppress_warnings=True, stepwise=True)print(stepwise_model.aic())# data.index.min(), # data.index.max()# Make a prediction for the next 30 daysfuture_dates = pd.date_range(start='2023-03-15', end='2023-04-14')future_forecast = stepwise_model.predict(n_periods =len(future_dates))# Create a DataFrame of forecasted values with future dates as the indexforecast_df = pd.DataFrame({'종가': future_forecast,'날짜': future_dates})forecast_df.set_index('날짜', inplace=True)# Print the forecasted valuesfull_df = pd.concat([closing_prices, forecast_df], axis =0)print(full_df)full_df.to_csv("data/samsung_forecast.csv")````chatGPT`가 제시한 코드를 기반으로 자료형을 맞춰 예측값과 결합시켜 예측값의 정확도를 평가할 수 있도록 로컬파일로 떨어뜨림.:::## 예측결과 시각화삼성전자 주식 예측 결과를 시각화하여 투자 예측 결과를 살펴보자.:::{.panel-tabset}### 시각화 {.unnumbered}```{r}library(tidyverse)full_tbl <-read_csv("data/samsung_forecast.csv") %>%## 자료형 변환 -----------mutate(날짜 = lubridate::ymd(날짜))future_data <- full_tbl %>%filter(날짜 >=as.Date("2023-03-15"))full_tbl %>%## 자료형 변환 -----------mutate(날짜 = lubridate::ymd(날짜)) %>%ggplot(aes(x = 날짜, y = 종가)) +geom_line(color="black") +scale_x_date(date_labels ="%y년 %m월") +scale_y_continuous(labels = scales::comma) +theme_bw(base_family ="MaruBuri Bold") +labs(x ="",title ="삼성전자주가 최근 3년 주가 추세",subtitle ="주가 데이터 크롤링을 chatGPT가 파이썬으로 작성",caption ="출처: https://r2bit.com/chatGPT/samsung.html") +geom_vline(xintercept =as.Date("2023-03-14")) +geom_line(data = future_data, aes(x=날짜, y=종가), color ="red", size =1.5)```### 주가예측 표 {.unnumbered}```{r}library(reactable)full_tbl %>%arrange(desc(날짜)) %>% reactable::reactable(columns =list( 종가 =colDef(format =colFormat(prefix ="₩ ", separators =TRUE, digits =0),align ="center") )) ```:::