---
title: "지도제작 대회"
subtitle: "비례국회의원"
description: |
비례국회의원에 대해서 살펴보자.
author:
- name: 이광춘
url: https://www.linkedin.com/in/kwangchunlee/
affiliation: 한국 R 사용자회
affiliation-url: https://github.com/bit2r
title-block-banner: true
format:
html:
theme: flatly
code-fold: true
code-overflow: wrap
toc: true
toc-depth: 3
toc-title: 목차
number-sections: true
highlight-style: github
self-contained: false
default-image-extension: jpg
filters:
- lightbox
lightbox: auto
link-citations: true
knitr:
opts_chunk:
eval: true
message: false
warning: false
collapse: true
comment: "#>"
R.options:
knitr.graphics.auto_pdf: true
editor_options:
chunk_output_type: console
---
```{r}
#| include: false
library(tidyverse)
library(rvest)
library(httr)
library(sf)
library(geogrid)
```
# 데이터셋
```{r}
#| eval: true
library(tidyverse)
library(rvest)
library(httr)
library(sf)
library(geogrid)

mp_raw <- read_rds("data/total_elected_tbl.rds")

prop_tbl <- mp_raw |>
  filter(sgTypecode == "7") |>
  select(result) |>
  unnest(result) |>
  mutate(정당 = case_when(jdName %in% c("한나라당", "새누리당", "자유한국당",
                                        "미래통합당", "국민의힘", "미래한국당") ~ "국민의힘",
                            jdName %in% c("새정치국민회의", "열린우리당", "통합민주당",
                                        "민주통합당", "더불어민주당", "더불어시민당") ~ "민주당",
                            TRUE ~ "그외정당")) |>

  count(sgId, 정당)
```
# 분석
## 표
```{r}
library(gt)

prop_tbl |>
  pivot_wider(names_from = 정당, values_from = n) |>
  mutate(소계 = 국민의힘 + 그외정당 + 민주당) |>
  select(선거=sgId, 민주당, 국민의힘, 그외정당, 소계) |>
  gt() |>
  grand_summary_rows(
    columns = c(민주당, 국민의힘, 그외정당),
    fns =  list(
      최소 ~ min(.),
      최대 ~ max(.),
      평균 ~ mean(.)
    ),
    fmt = ~ fmt_integer(.),
    side = "top"
  ) |>
  cols_align(columns = everything(), "center")
```
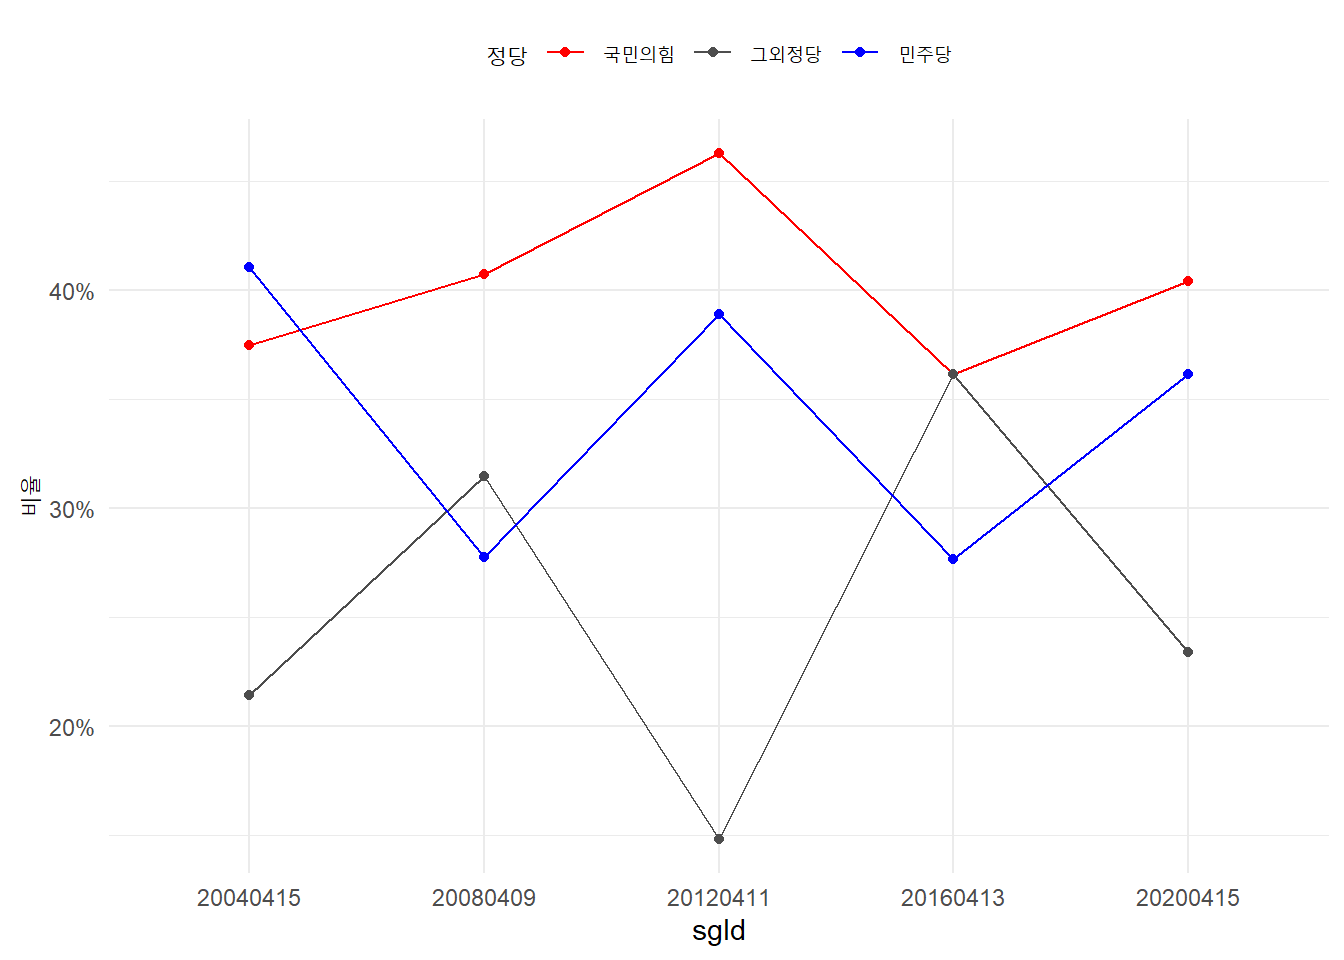
## 그래프
```{r}
percent_tbl <- prop_tbl |>
  group_by(sgId) |>
  summarise(비율 = n / sum(n)) |>
  ungroup()

prop_tbl |>
  bind_cols(percent_tbl |> select(비율)) |>
  ggplot(aes(x = sgId, y = 비율, color = 정당, group = 정당)) +
    geom_line() +
    geom_point() +
    scale_color_manual(values = c("국민의힘" = "red",
                                  "민주당"   = "blue",
                                  "그외정당" = "gray30")) +
    scale_y_continuous(labels = scales::percent) +
    theme_minimal() +
    theme(legend.position = "top")
```