---
title: "지도제작 대회"
subtitle: "인구비례 선거구"
description: |
인구비례 선거구 지도가 필요한 시점이 되었습니다.
author:
- name: 이광춘
url: https://www.linkedin.com/in/kwangchunlee/
affiliation: 한국 R 사용자회
affiliation-url: https://github.com/bit2r
title-block-banner: true
format:
html:
theme: flatly
code-fold: true
code-overflow: wrap
toc: true
toc-depth: 3
toc-title: 목차
number-sections: true
highlight-style: github
self-contained: false
default-image-extension: jpg
filters:
- lightbox
lightbox: auto
link-citations: true
knitr:
opts_chunk:
eval: true
message: false
warning: false
collapse: true
comment: "#>"
R.options:
knitr.graphics.auto_pdf: true
editor_options:
chunk_output_type: console
---
```{r}
#| include: false
library(tidyverse)
library(rvest)
library(httr)
library(sf)
library(geogrid)
```
# 데이터셋
```{r}
#| eval: false
library(tidyverse)
library(rvest)
library(httr)
library(sf)
library(geogrid)
sf_use_s2(FALSE)

precinct_sf <- st_read("data/2020_21_elec_253.json")

sido_sf <- precinct_sf |>
  # filter(SGG_1 == "부산") |>
  calculate_grid(grid_type="hexagonal", learning_rate = 0.05, seed=20)

plot(sido_sf)

sido_hex <- assign_polygons(precinct_sf, sido_sf)
```
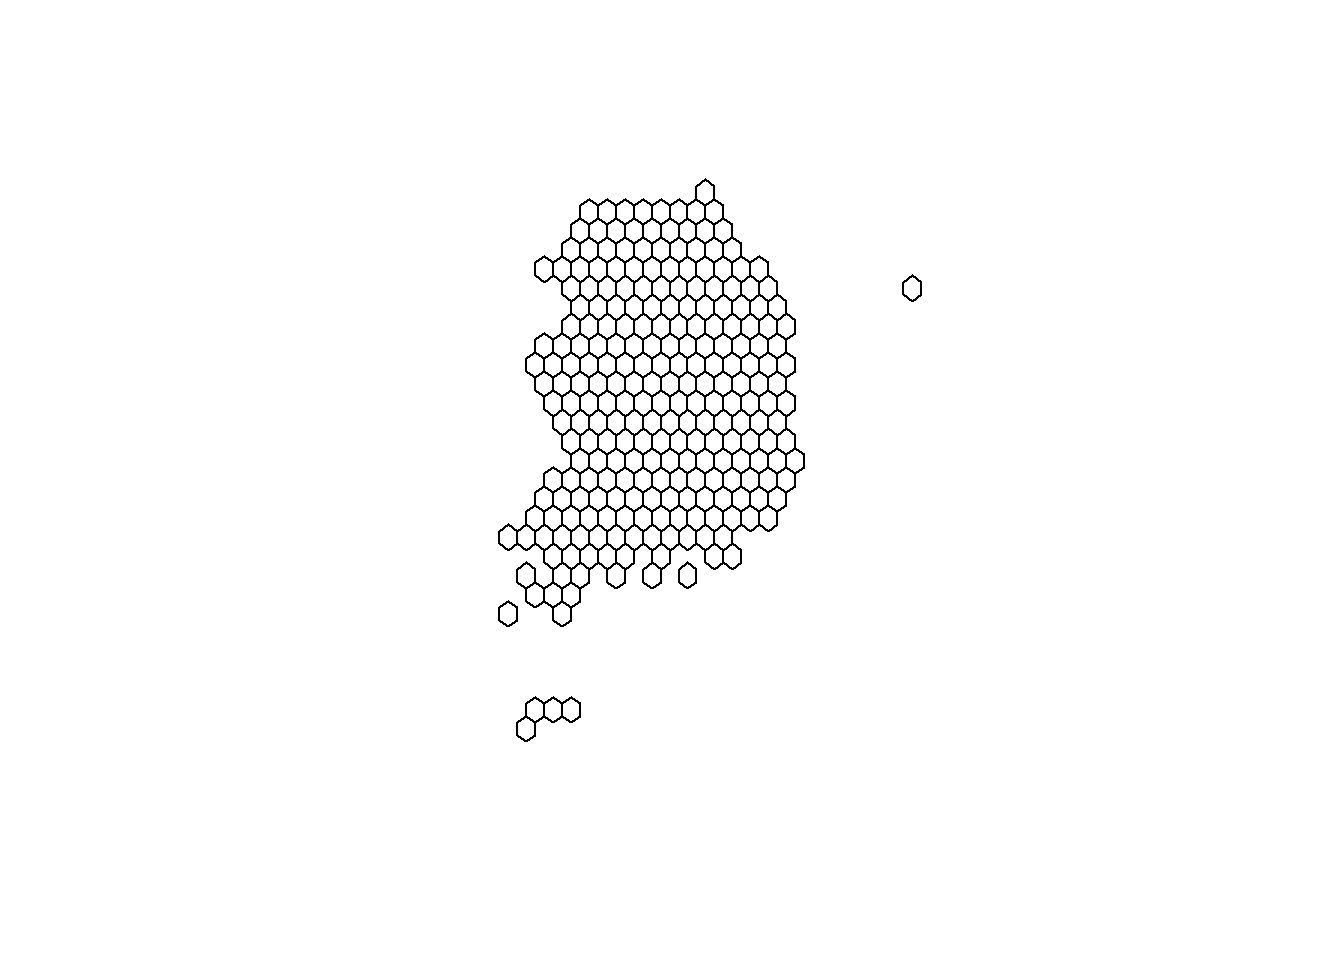
```{r}
# sido_hex |>
# st_write("data/precinct_21.geojson")
sido_hex <-
st_read("data/precinct_21.geojson")
sido_hex |>
st_geometry() |>
plot()
```
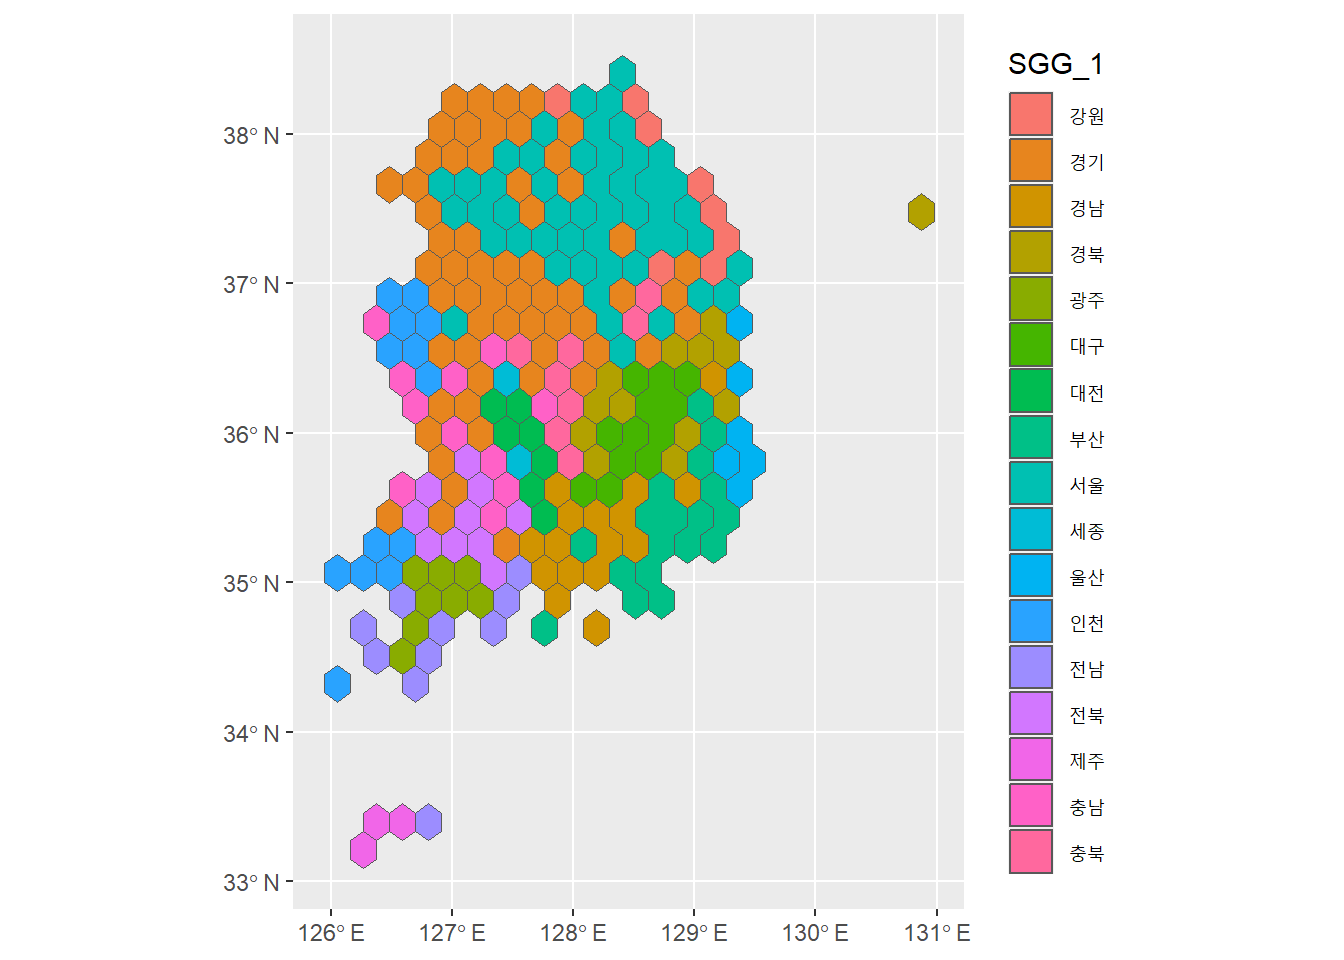
# 시도 경계
```{r}
sido_boundary_hex <- sido_hex |>
  # ungroup() |>
  group_by(SGG_1) |>
  summarise(geometry = st_union(geometry))

sido_boundary_hex |>
  ggplot() +
    geom_sf(aes(geometry = geometry, fill = SGG_1))
```
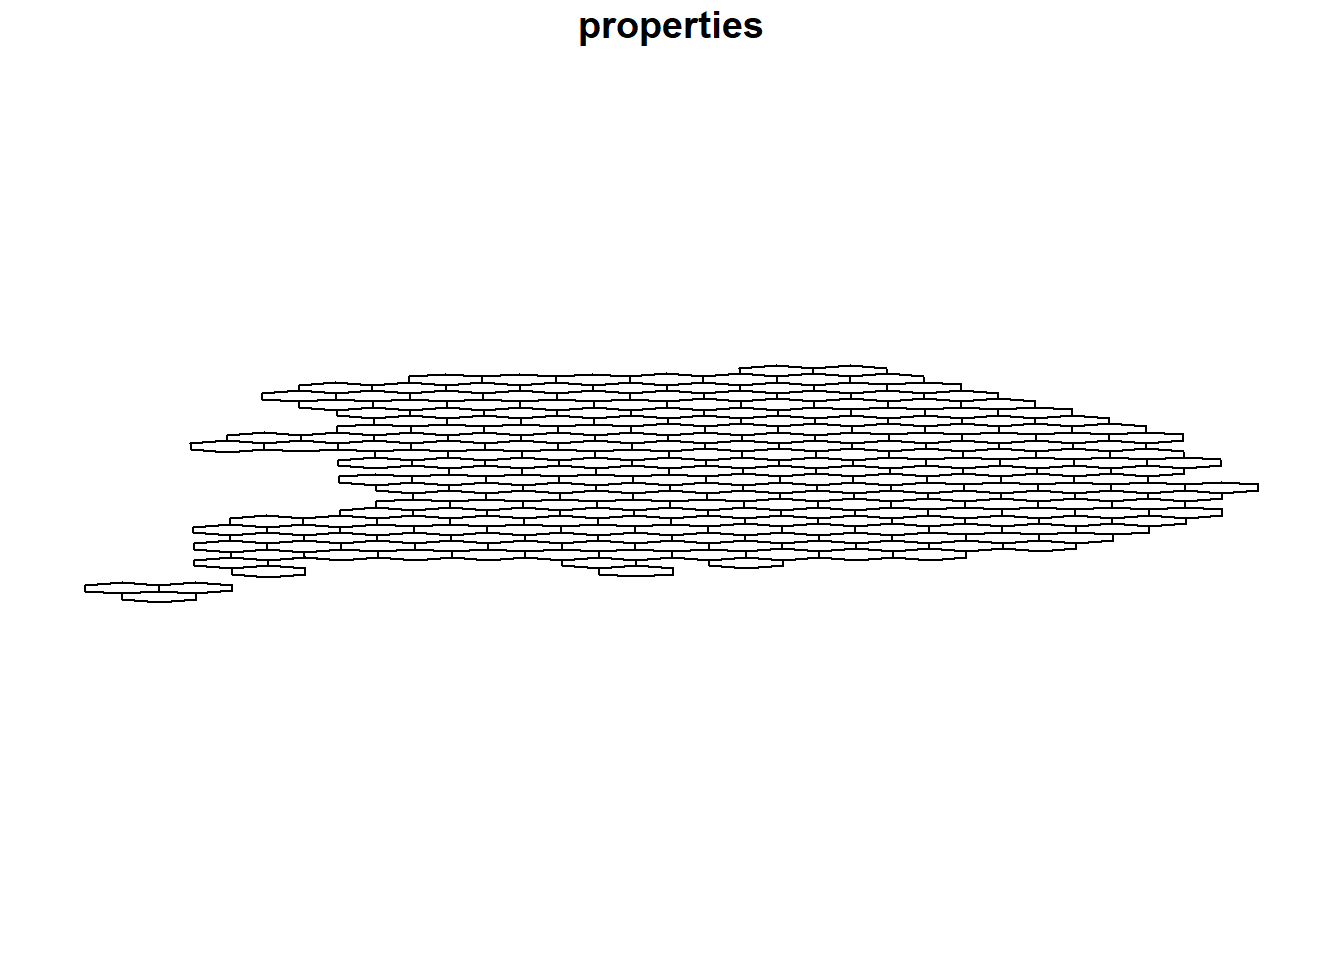
# SVG to geojson
```{r}
svg_shp <- st_read("data/precinct_21/2020_South_Korean_legislative_election_Results_Cartogram-polygon.shp")
svg_shp |>
plot()
```
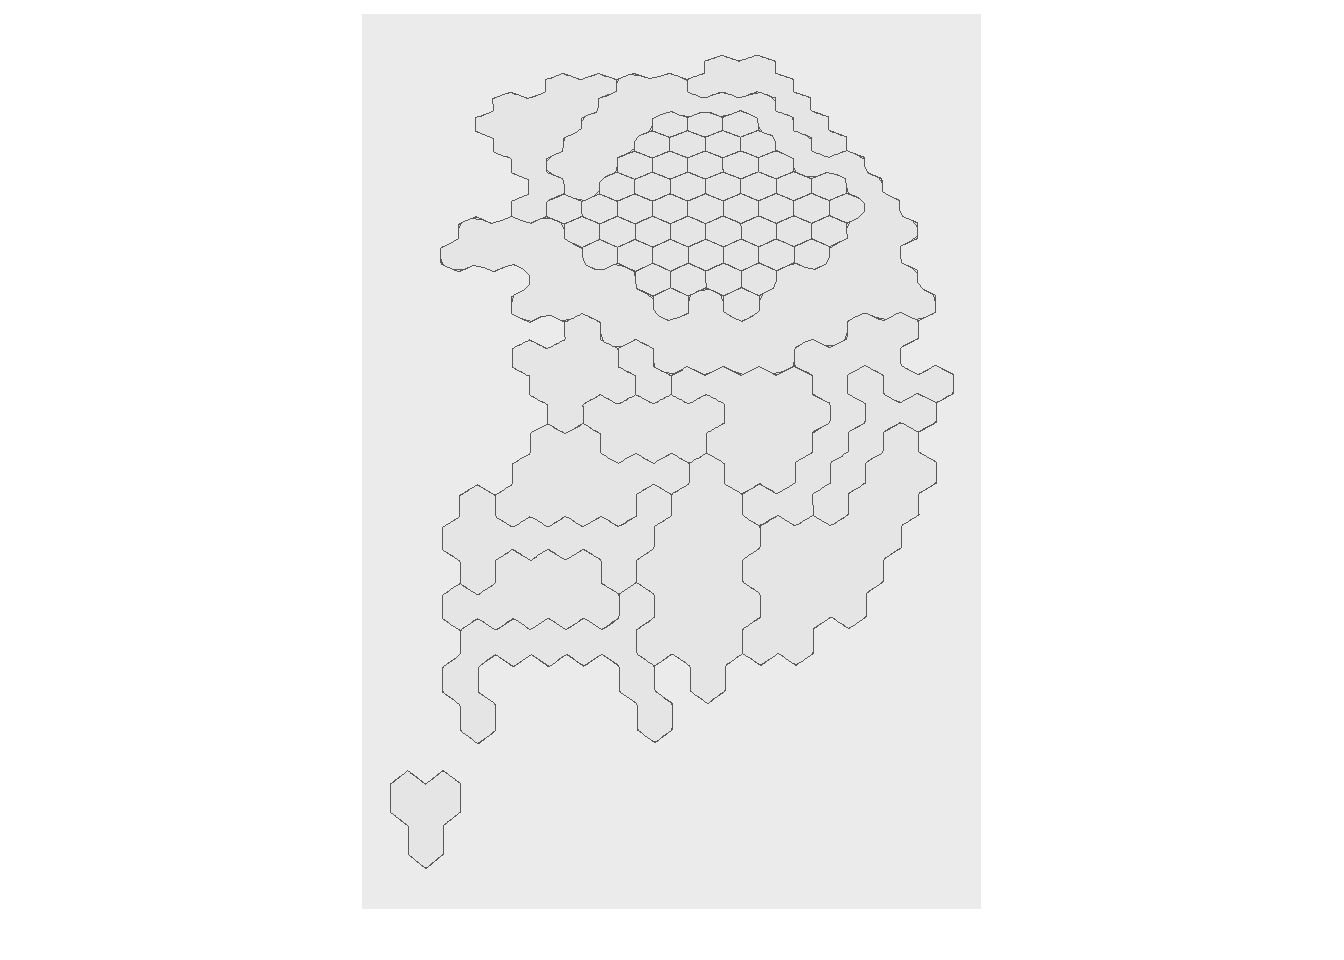
# svg to geojson
```{r}
mapbox_sf <- st_read("data/precinct_21/features.geojson")
south_korea_bbox <- st_bbox(c(
xmin = 124.61, # Minimum longitude
ymin = 33.10, # Minimum latitude
xmax = 131.87, # Maximum longitude
ymax = 38.45 # Maximum latitude
), crs = st_crs(4326)) # EPSG:4326 coordinate reference system
mapbox_sf |>
st_set_crs(4326) |>
# st_crop(south_korea_bbox) |>
ggplot() +
geom_sf(aes(geometry = geometry))
```