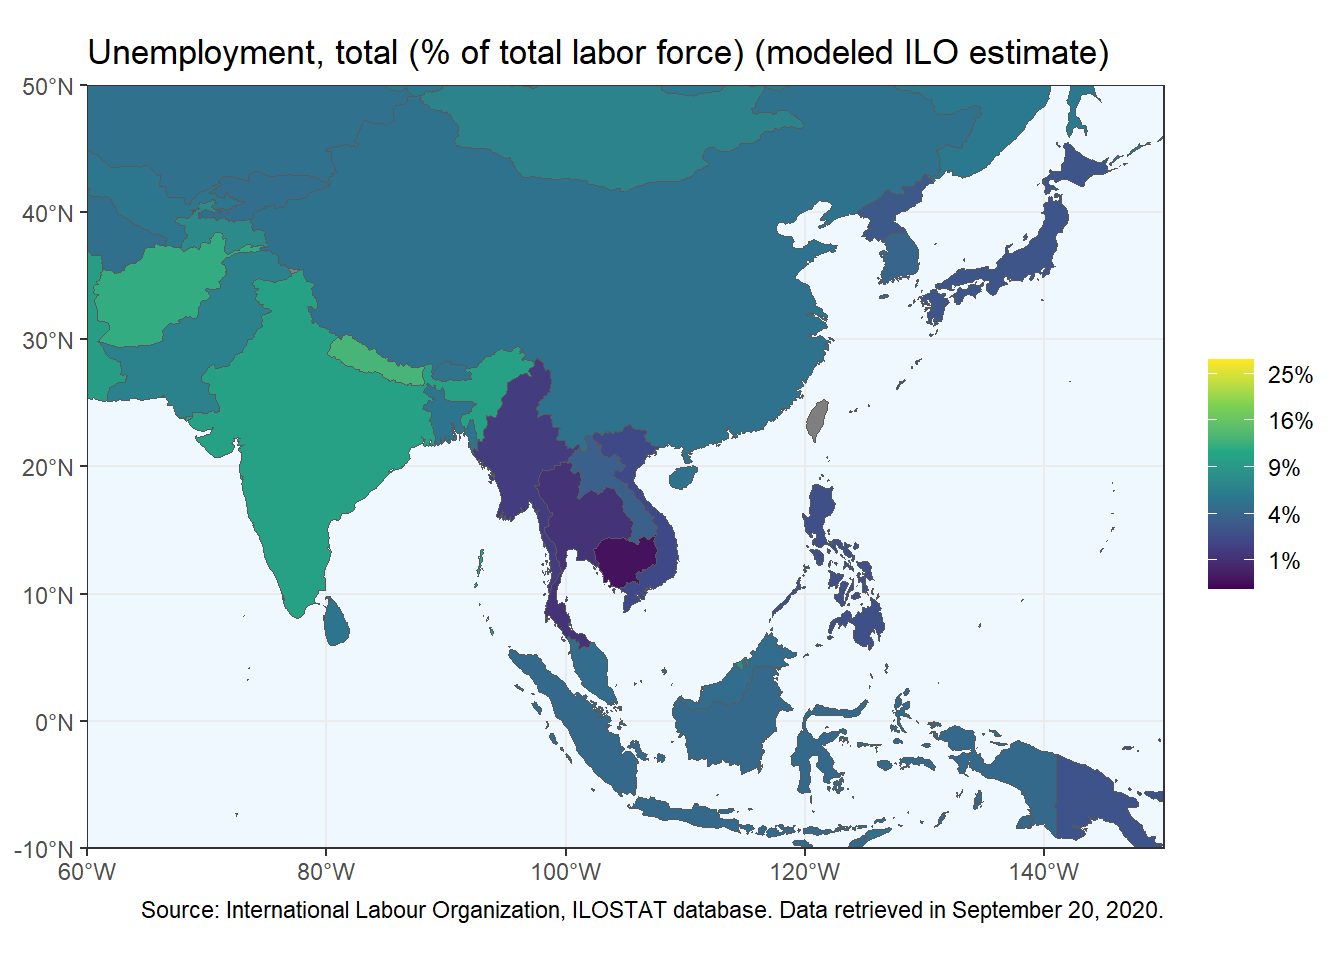
OpenStreetMap 내보내기(Export) 에서 테두리 상자(Bounding Box) 를 특정하여 아시아 지역으로 한정하여 시각화한다.
코드
## ----Create bounding box-------------------------# Choose manually the region to plot with Open Street Map# https://www.openstreetmap.org/exportwindow_coord<-st_sfc(st_point(c(60, -10)), #left, bottomst_point(c(150,50)), #right, top crs =4326#the EPSG identifier of WGS84 (used in GPS))window_coord_sf<-window_coord%>%st_transform(crs =target_crs)%>%st_coordinates()# retrieve coordinates
코드
## ----Plot regional map---------------------------world_wsg%>%left_join(df, by =c("iso_a3"="iso3c"))%>%ggplot()+geom_sf(aes(fill =SL.UEM.TOTL.ZS))+# window of the mapcoord_sf( xlim =window_coord_sf[, "X"], ylim =window_coord_sf[, "Y"], expand =FALSE)+scale_fill_viridis_c( trans ="sqrt", labels =scales::percent_format(scale =1), breaks =c(1:5)^2)+# fix labels if needed: https://stackoverflow.com/a/60733863scale_x_continuous( labels =function(x)paste0(x, '\u00B0', "W"))+scale_y_continuous( labels =function(x)paste0(x, '\u00B0', "N"))+theme_bw()+theme(panel.background =element_rect(fill ="aliceblue"))+labs( title =indicator_info$indicator, fill =NULL, caption =paste("Source:", indicator_info$source_org))
소스 코드
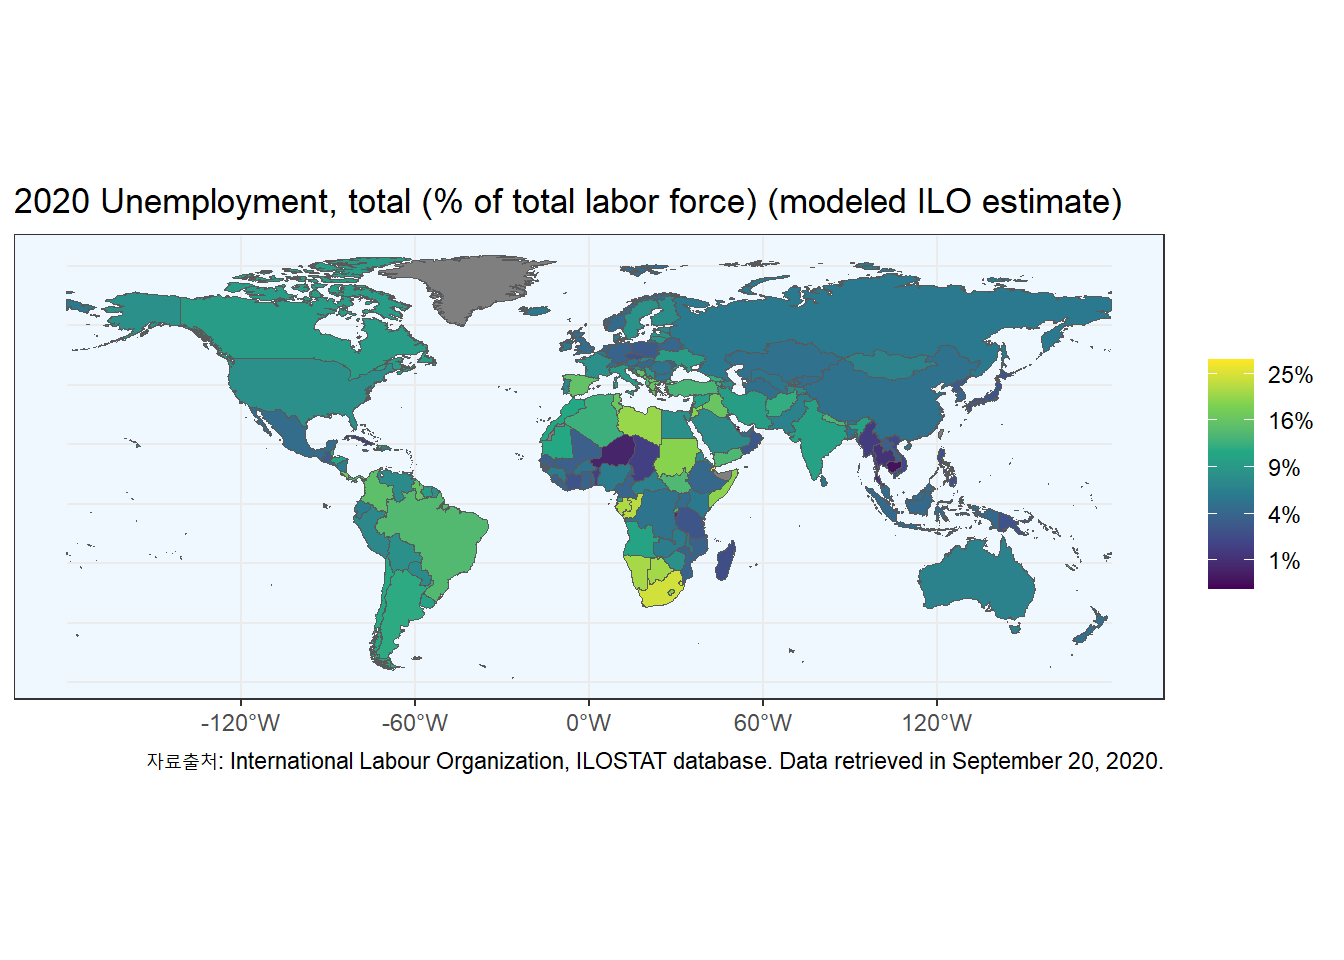
---title: "지도제작 대회"subtitle: "아시아 실업율"description: | 세계은행과 지도를 결합하여 아시아 국가 실업율을 도식화하자.author: - name: 이광춘 url: https://www.linkedin.com/in/kwangchunlee/ affiliation: 한국 R 사용자회 affiliation-url: https://github.com/bit2rtitle-block-banner: trueformat: html: theme: flatly code-fold: true code-overflow: wrap toc: true toc-depth: 3 toc-title: 목차 number-sections: true highlight-style: github self-contained: false default-image-extension: jpgfilters: - lightboxlightbox: autolink-citations: trueknitr: opts_chunk: message: false warning: false collapse: true comment: "#>" R.options: knitr.graphics.auto_pdf: trueeditor_options: chunk_output_type: console---:::{.callout-tip}### 소스코드[FelixAnalytix/YouTube](https://github.com/FelixAnalytix/YouTube):::# 패키지```{r}#| eval: trueif (!require("tidyverse")) install.packages("tidyverse")if (!require("rnaturalearth")) install.packages("rnaturalearth")if (!require("sf")) install.packages("sf")if (!require("wbstats")) install.packages("wbstats")library(tidyverse)library(rnaturalearth) # World Map Data from Natural Earthlibrary(sf) # Geographic Simple Features in Rlibrary(wbstats) # access World Bank APIcrs_LONGLAT <-"+proj=longlat +datum=WGS84 +no_defs"```# 데이터## 지도```{r}world <-ne_countries(scale="medium", returnclass="sf") %>%filter(admin !="Antarctica")## ----Change World map projection-----------------# Mollweide projtarget_crs <-"+proj=longlat +datum=WGS84 +no_defs"world_wsg <- world %>%st_transform(crs = target_crs)```## 실업율```{r}## ----Get data from the World Bank----------------# Example: Unemployment (% of labor force)# https://data.worldbank.org/indicator/SL.UEM.TOTL.ZSind <-"SL.UEM.TOTL.ZS"indicator_info <- wb_cachelist$indicators %>%filter(indicator_id == ind)indicator_info$indicator## ----Download data from World Bank---------------df <-wb_data(ind, start_date =2020) %>%filter(date ==2020)glimpse(df)```# 시각화## 전세계```{r}## ----Plot world map------------------------------world_wsg %>%left_join(df, by =c("iso_a3"="iso3c")) %>%ggplot() +geom_sf(aes(fill = SL.UEM.TOTL.ZS)) +scale_fill_viridis_c(trans ="sqrt",labels = scales::percent_format(scale =1),breaks =c(1:5)^2) +# fix labels if needed: https://stackoverflow.com/a/60733863scale_x_continuous(labels =function(x) paste0(x, '\u00B0', "W") ) +scale_y_continuous(labels =function(x) paste0(x, '\u00B0', "N") ) +theme_bw() +theme(panel.background =element_rect(fill ="aliceblue")) +labs(title =paste(unique(df$date), indicator_info$indicator),fill =NULL,caption =paste("자료출처:", indicator_info$source_org) )```## 아시아[OpenStreetMap](https://www.openstreetmap.org/export) 내보내기(Export) 에서 테두리 상자(Bounding Box) 를 특정하여 아시아 지역으로 한정하여 시각화한다.```{r}## ----Create bounding box-------------------------# Choose manually the region to plot with Open Street Map# https://www.openstreetmap.org/exportwindow_coord <-st_sfc(st_point(c(60, -10)), #left, bottomst_point(c(150,50)), #right, topcrs =4326#the EPSG identifier of WGS84 (used in GPS))window_coord_sf <- window_coord %>%st_transform(crs = target_crs) %>%st_coordinates() # retrieve coordinates```[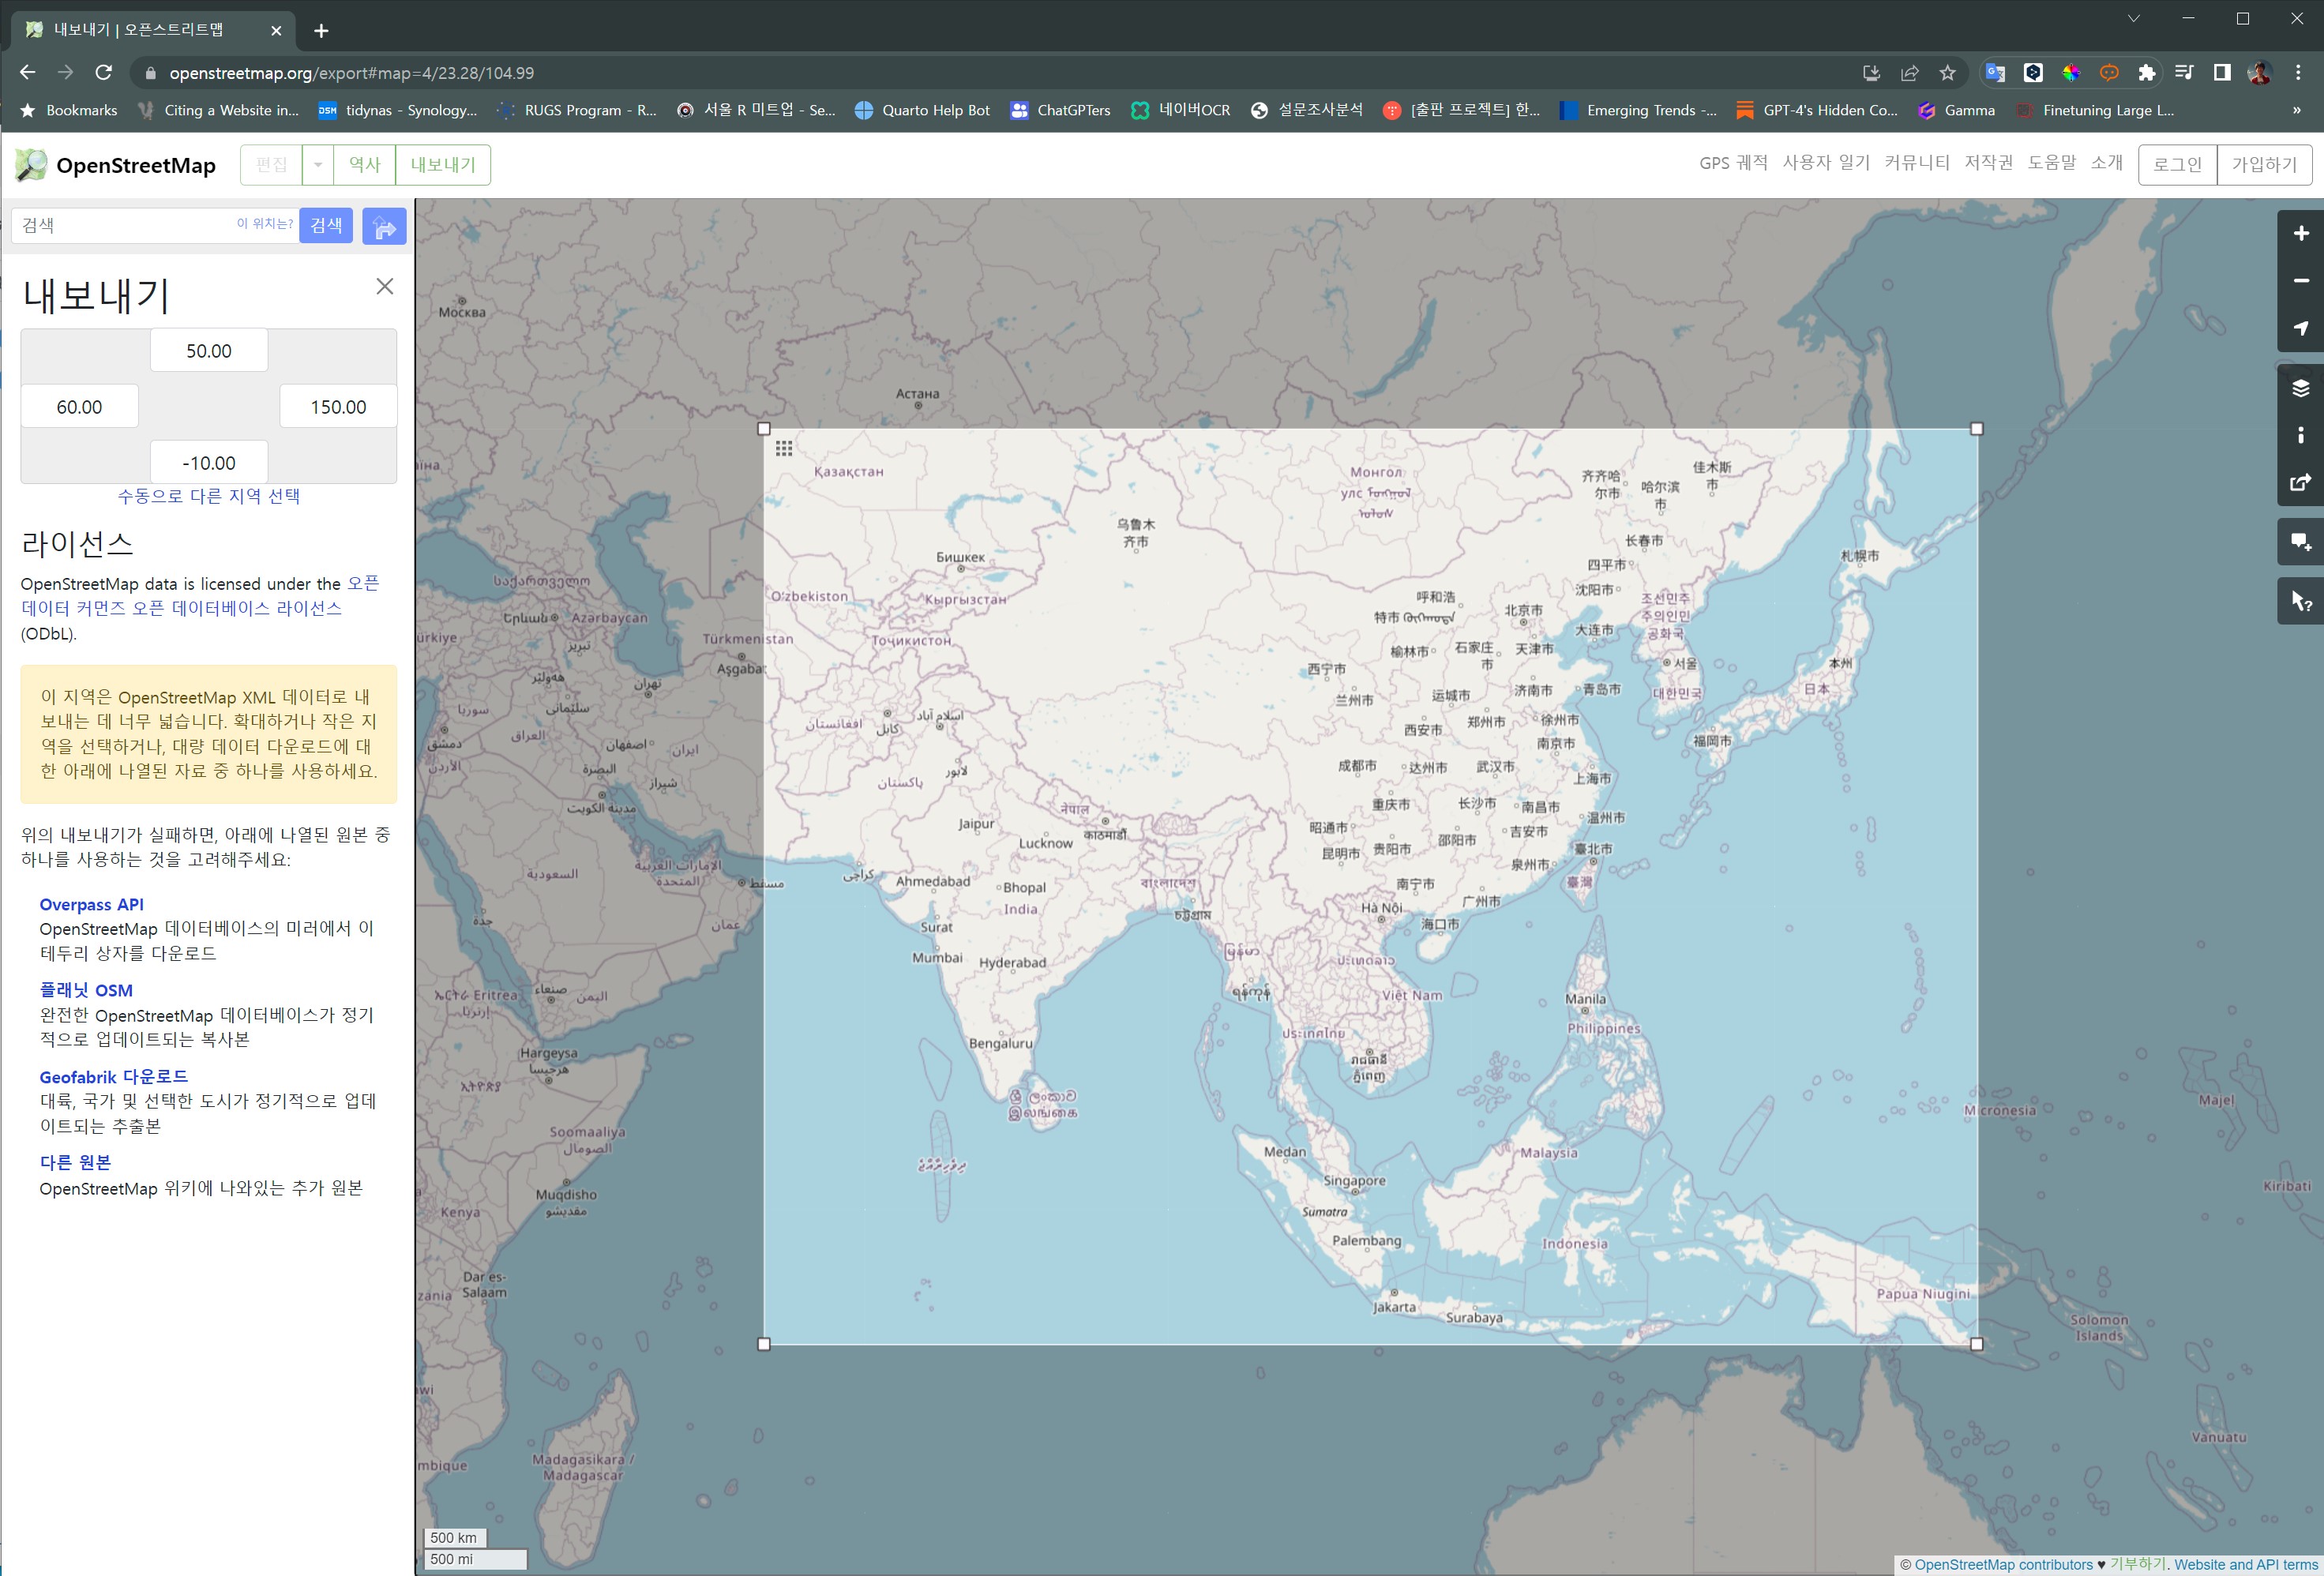]{.aside}```{r}## ----Plot regional map---------------------------world_wsg %>%left_join(df, by =c("iso_a3"="iso3c")) %>%ggplot() +geom_sf(aes(fill = SL.UEM.TOTL.ZS)) +# window of the mapcoord_sf(xlim = window_coord_sf[, "X"],ylim = window_coord_sf[, "Y"],expand =FALSE ) +scale_fill_viridis_c(trans ="sqrt", labels = scales::percent_format(scale =1),breaks =c(1:5)^2 ) +# fix labels if needed: https://stackoverflow.com/a/60733863scale_x_continuous(labels =function(x) paste0(x, '\u00B0', "W") ) +scale_y_continuous(labels =function(x) paste0(x, '\u00B0', "N") ) +theme_bw() +theme(panel.background =element_rect(fill ="aliceblue")) +labs(title = indicator_info$indicator,fill =NULL,caption =paste("Source:", indicator_info$source_org) )```