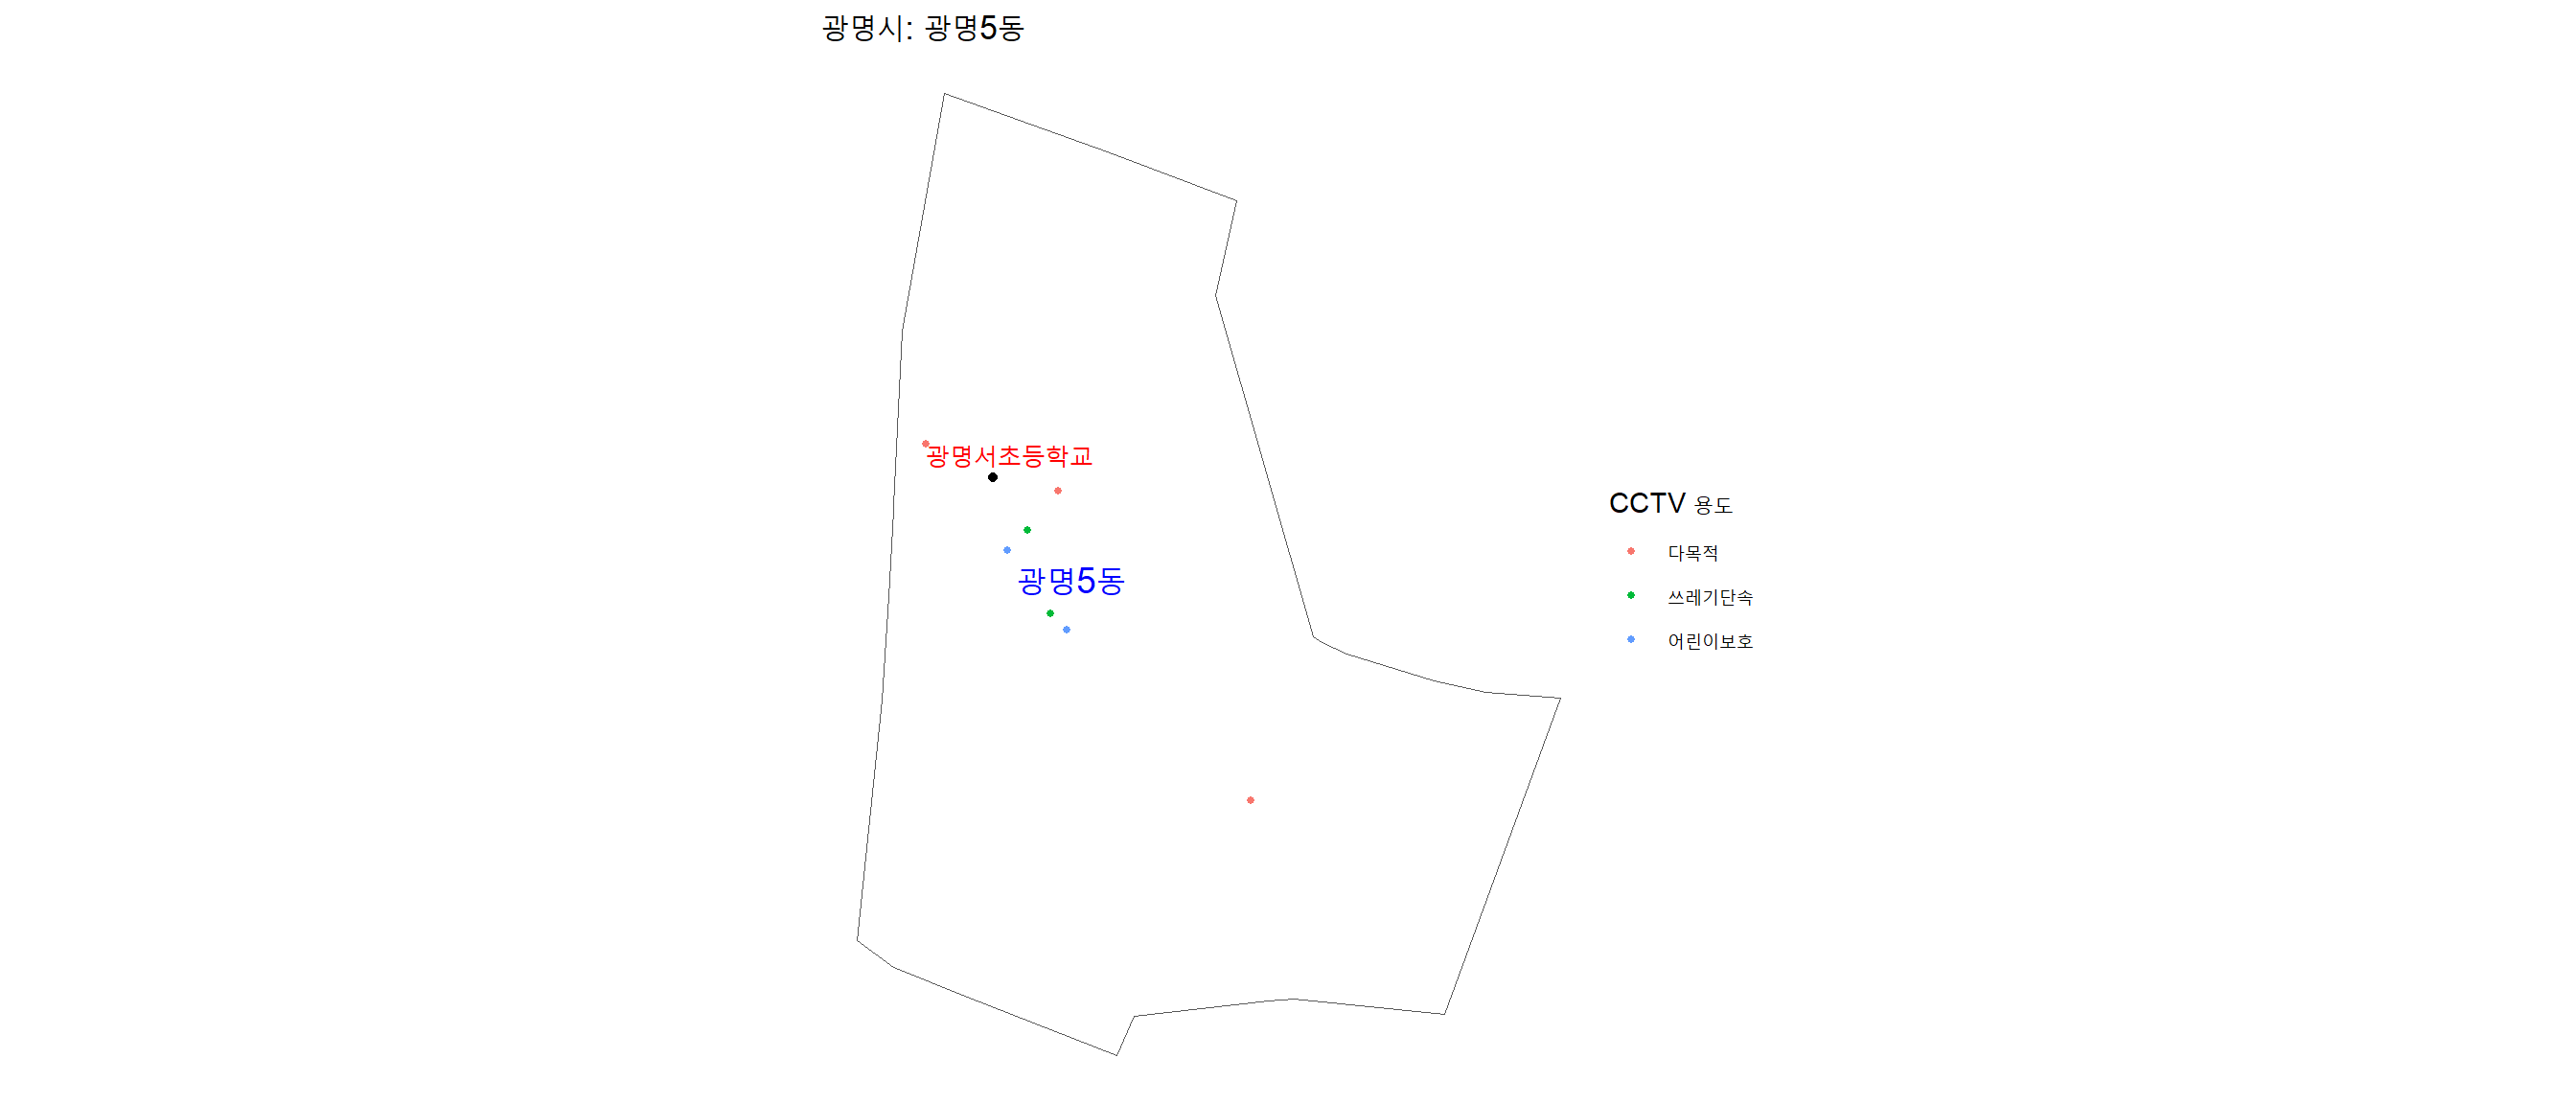
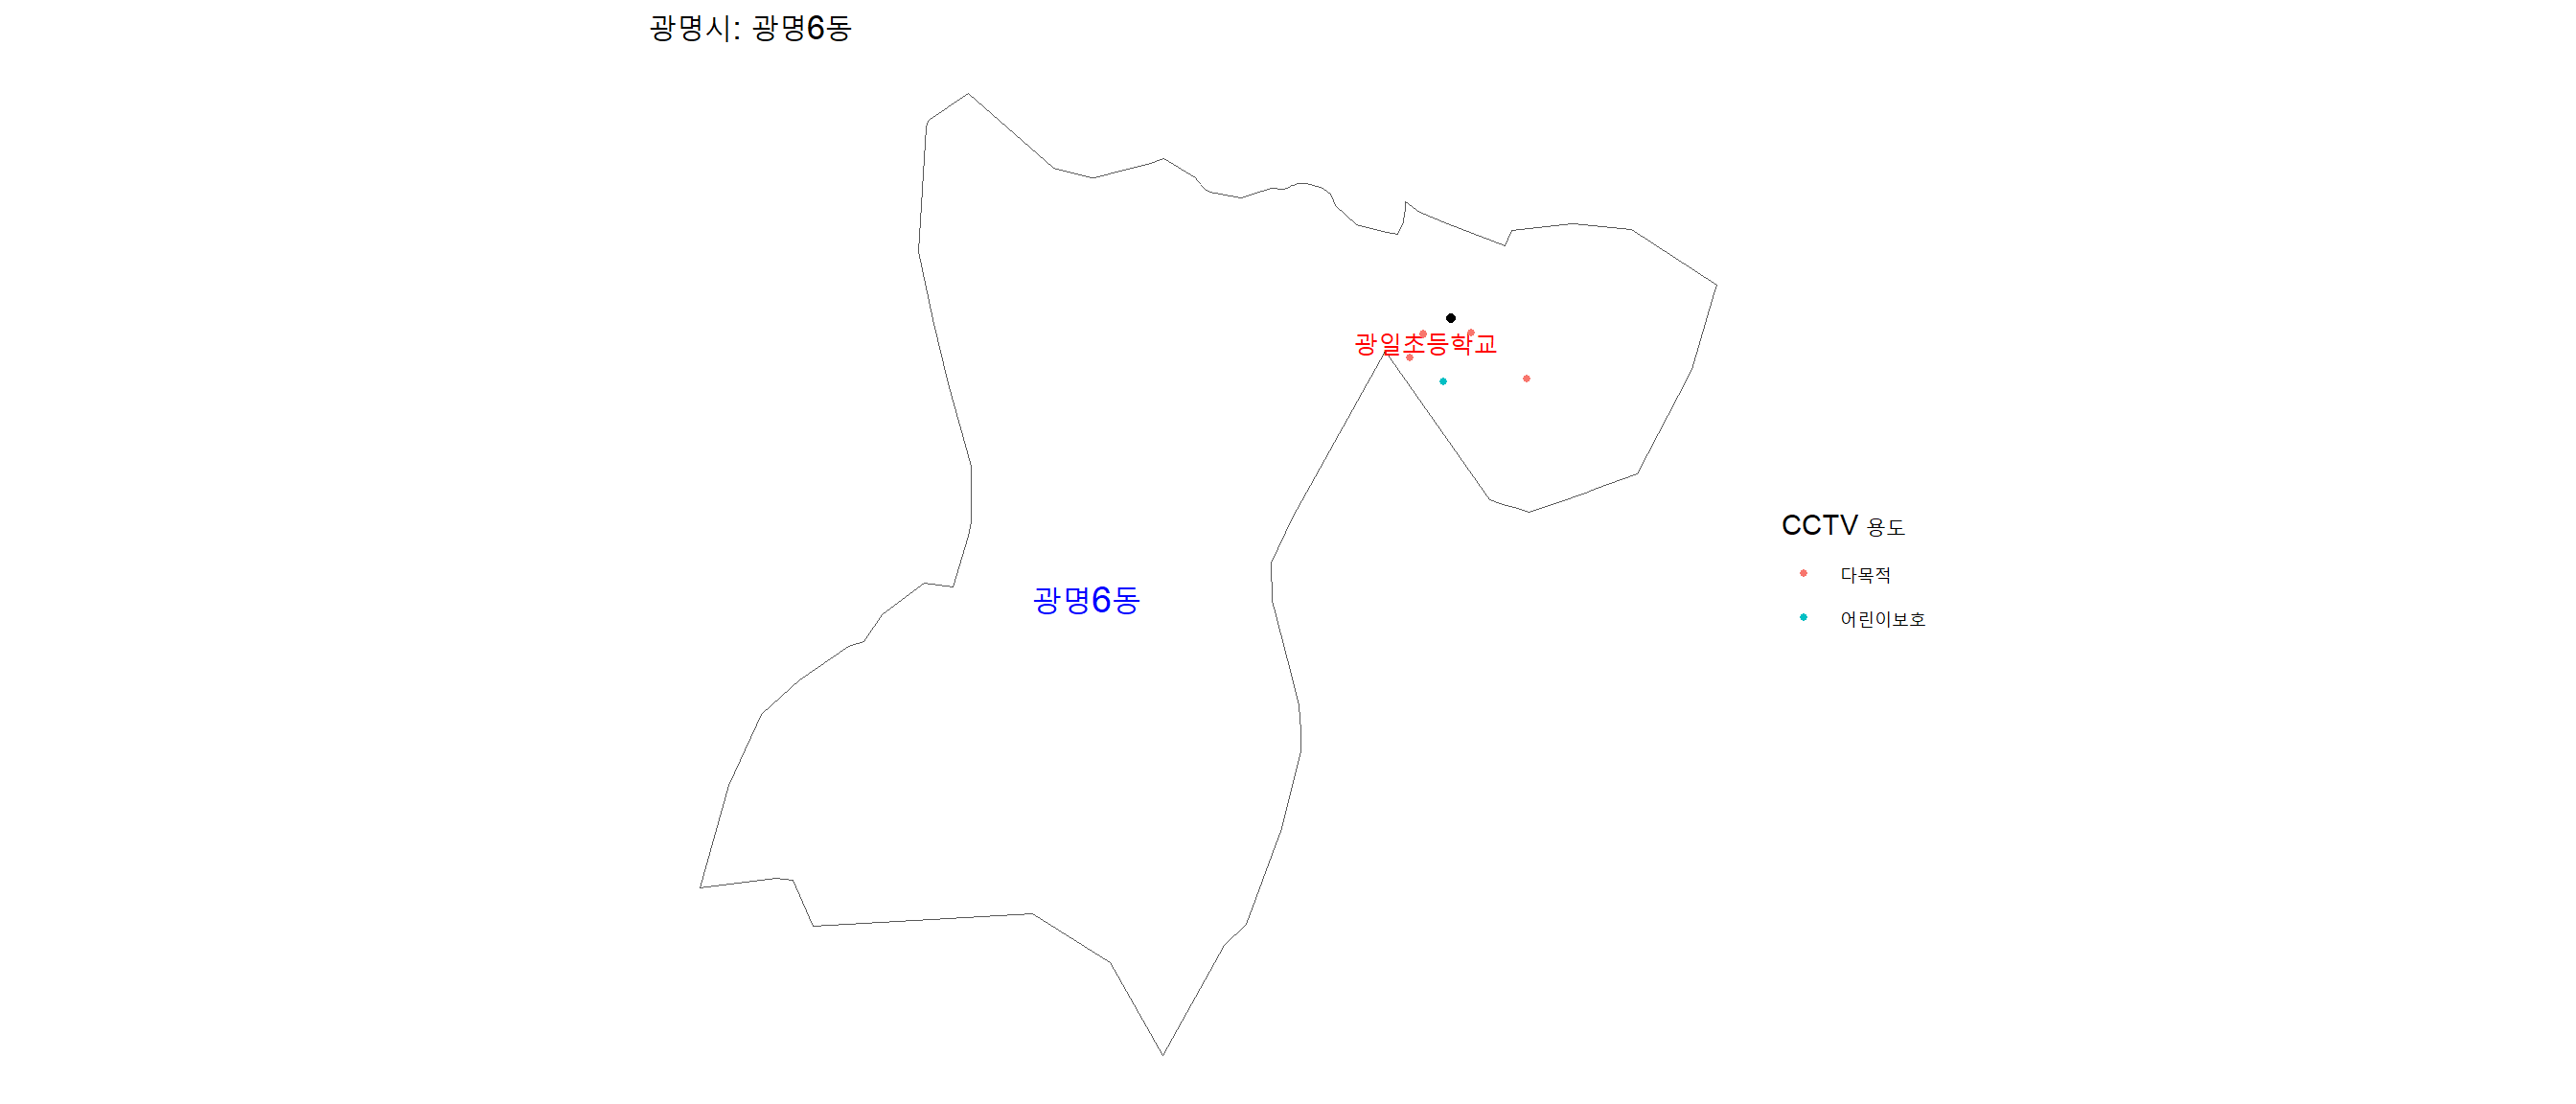
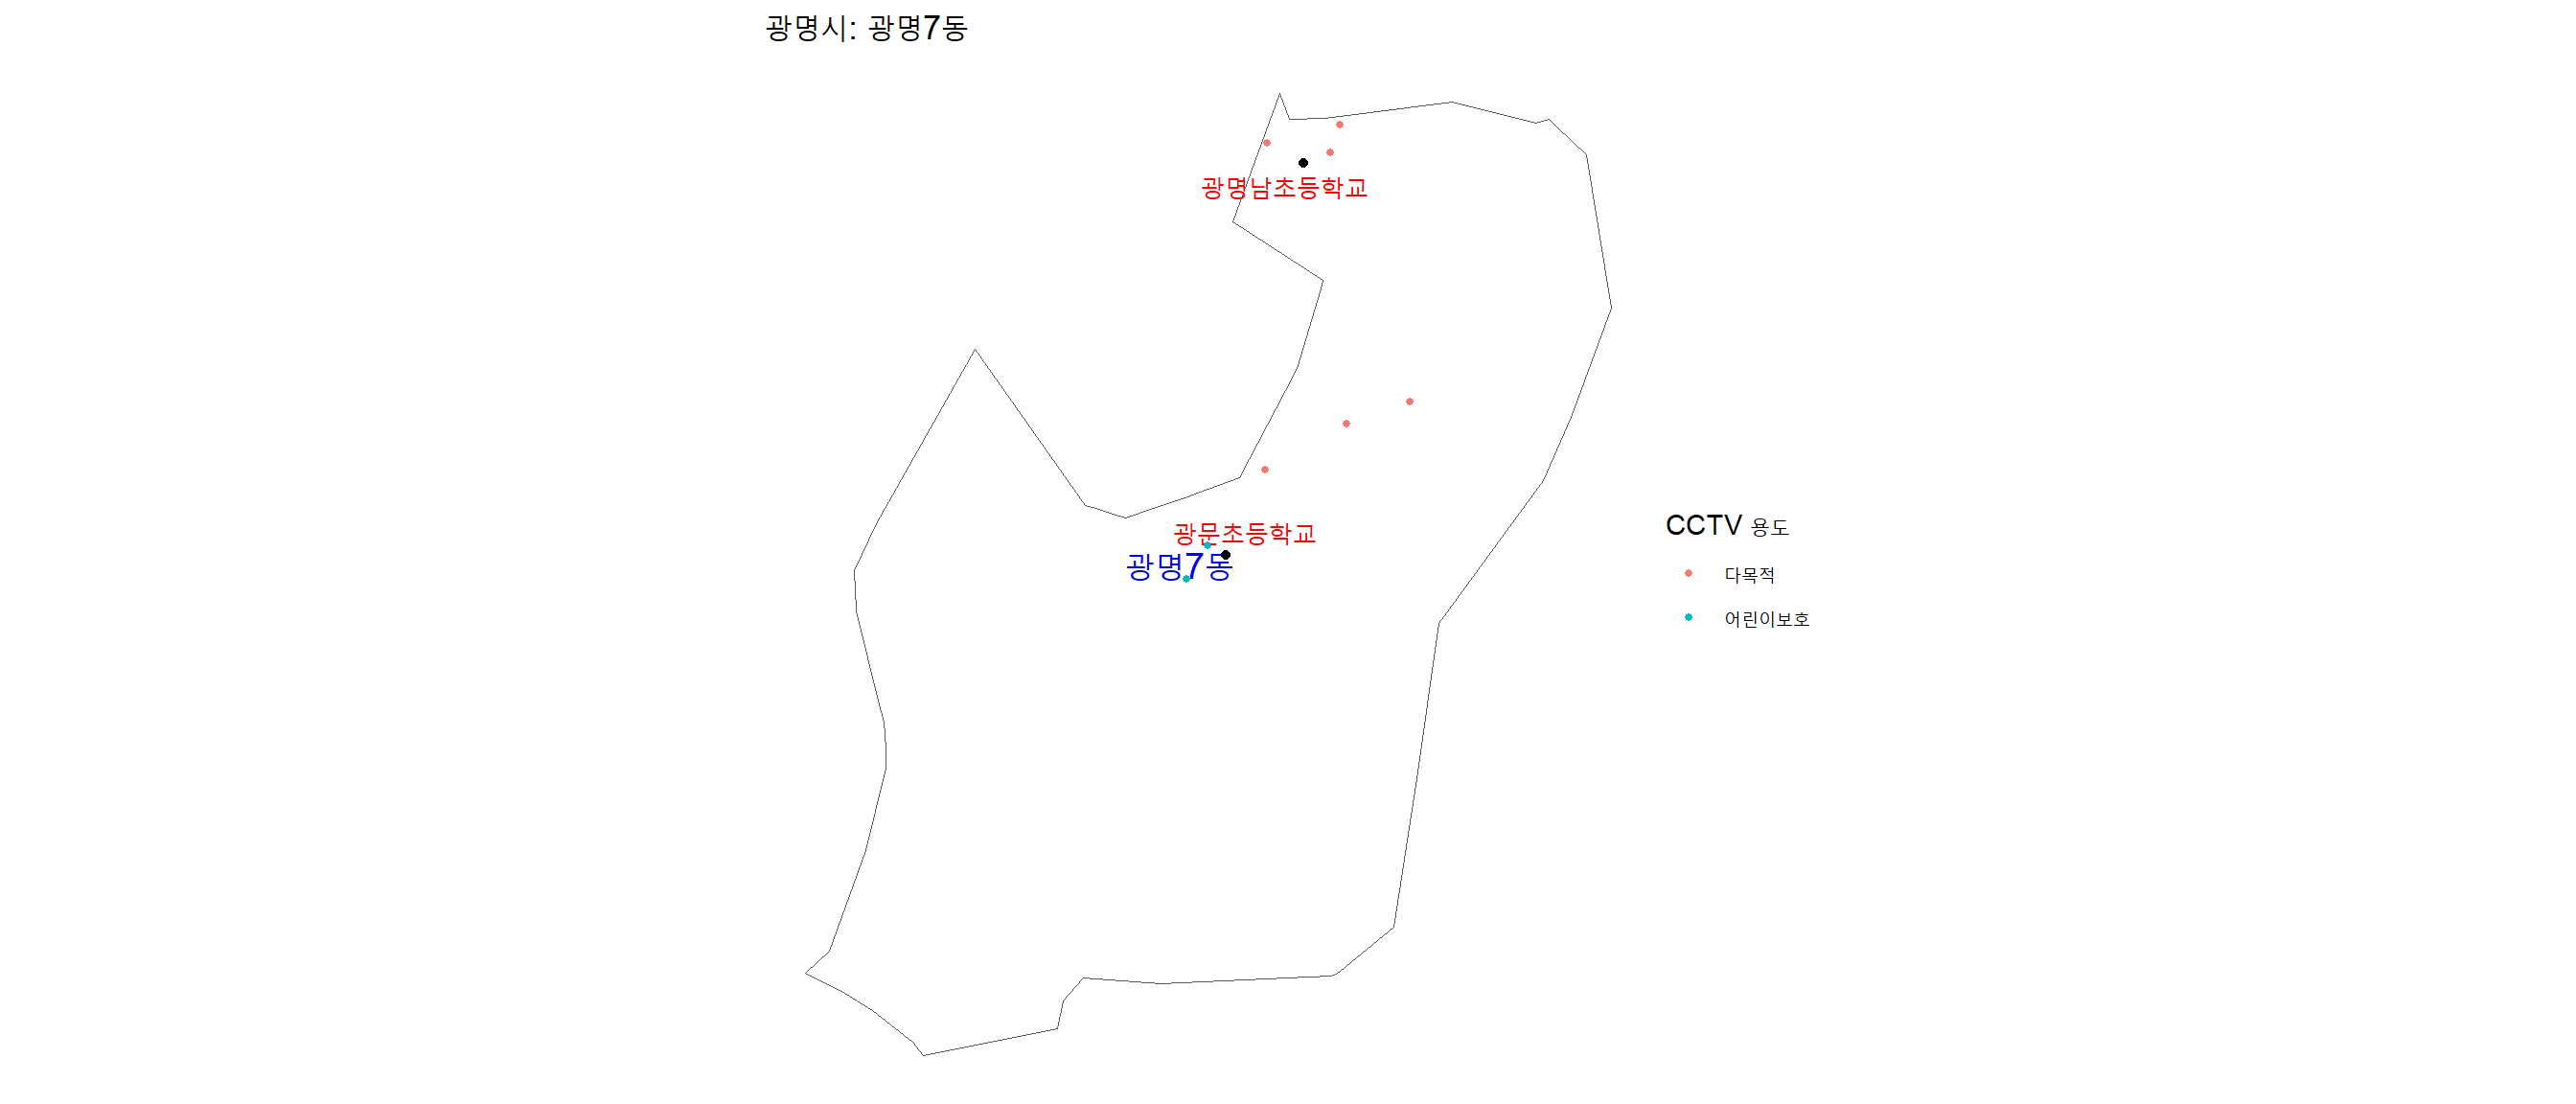
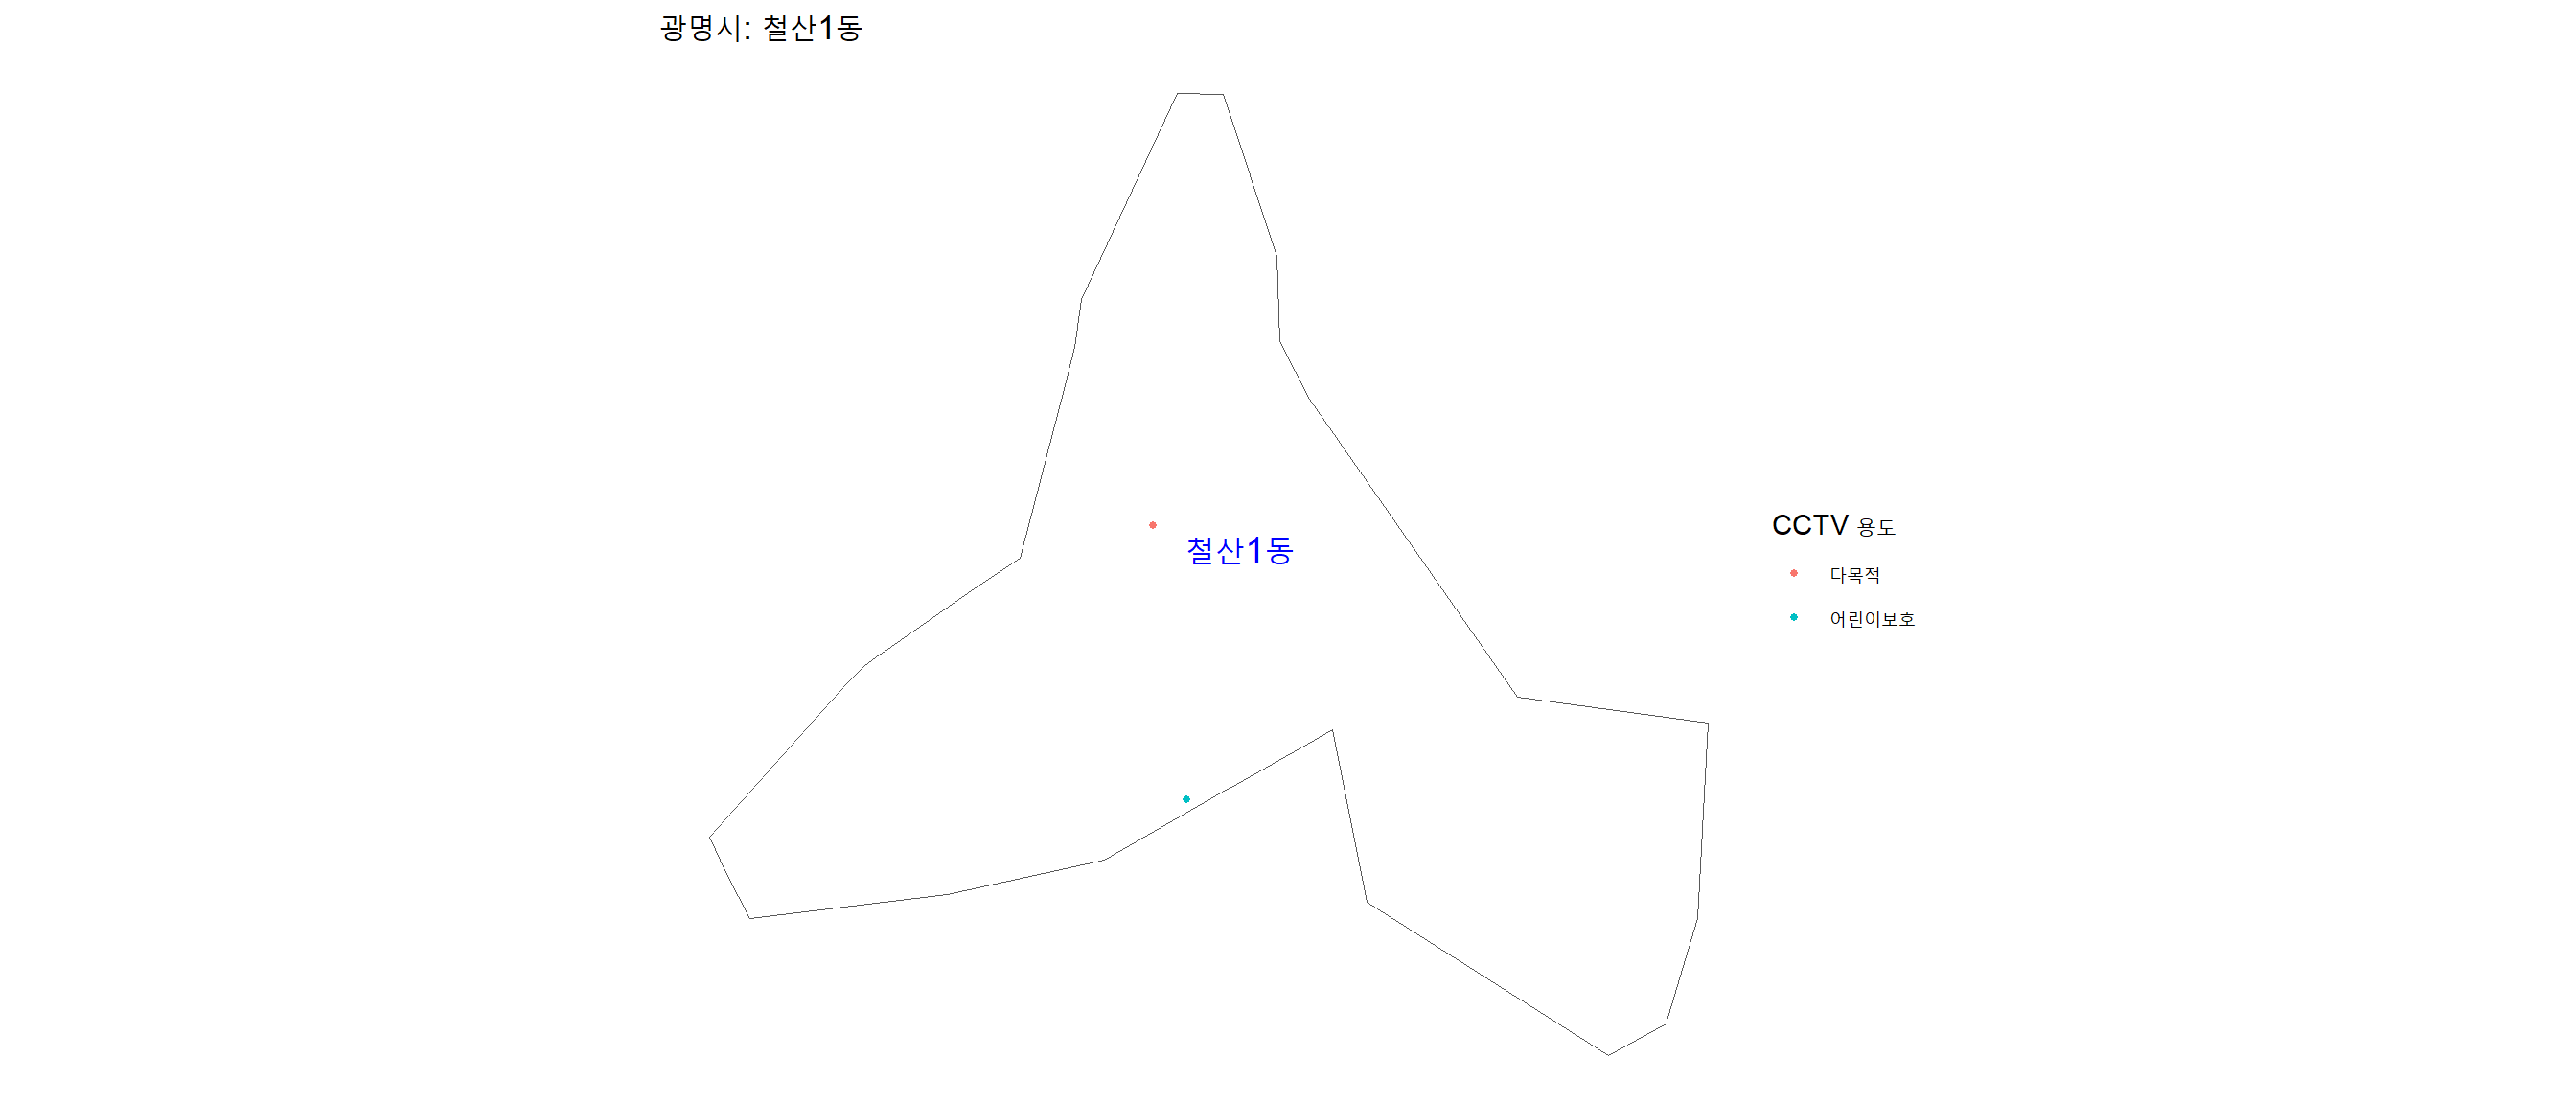
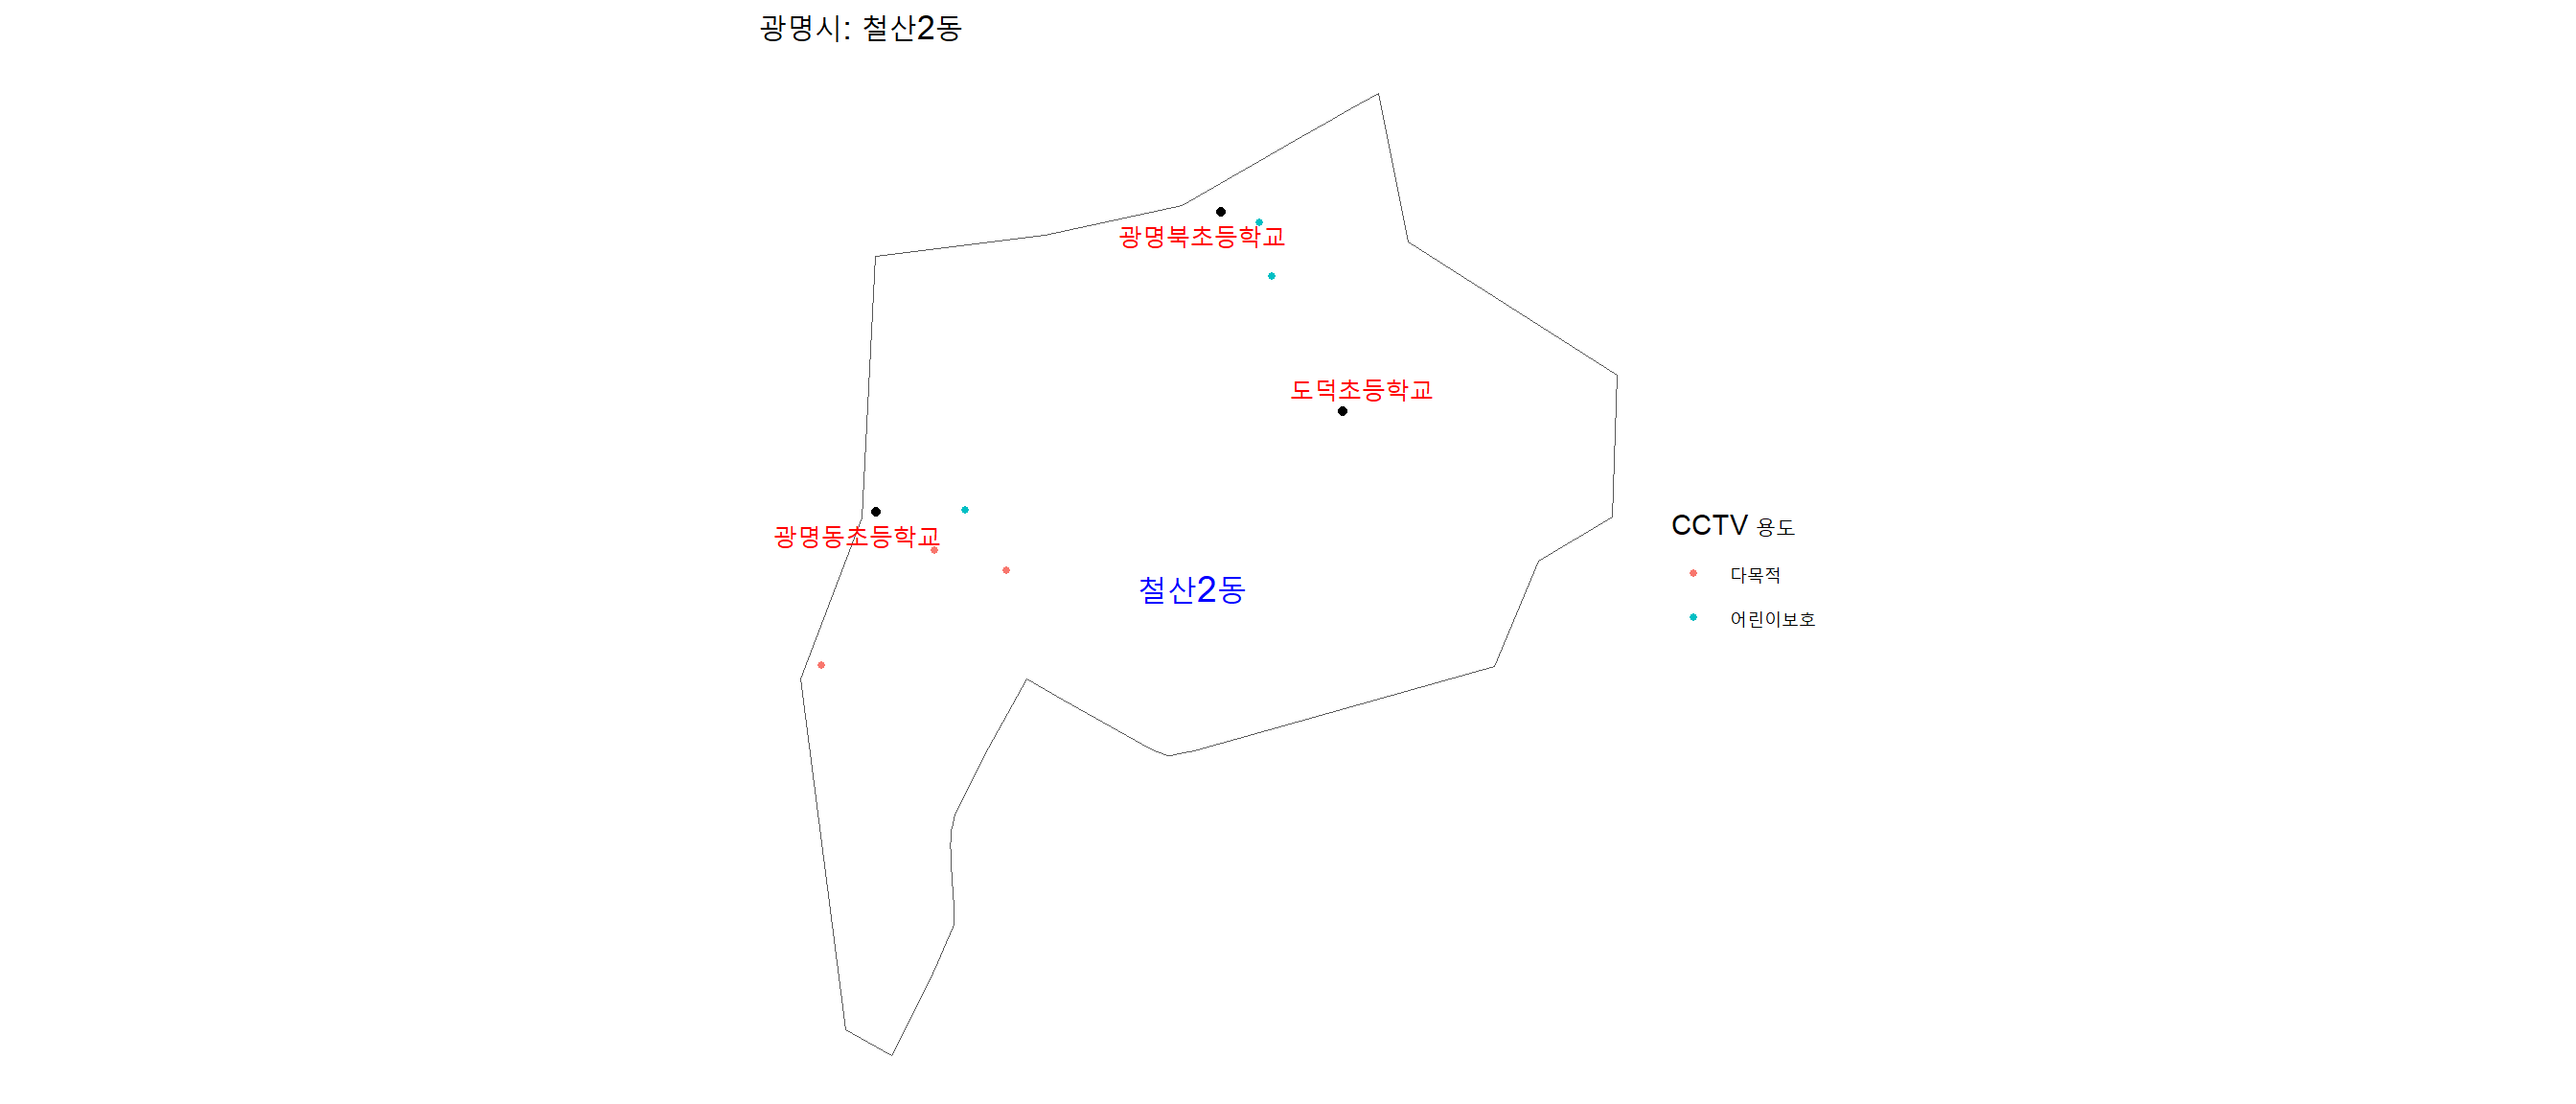
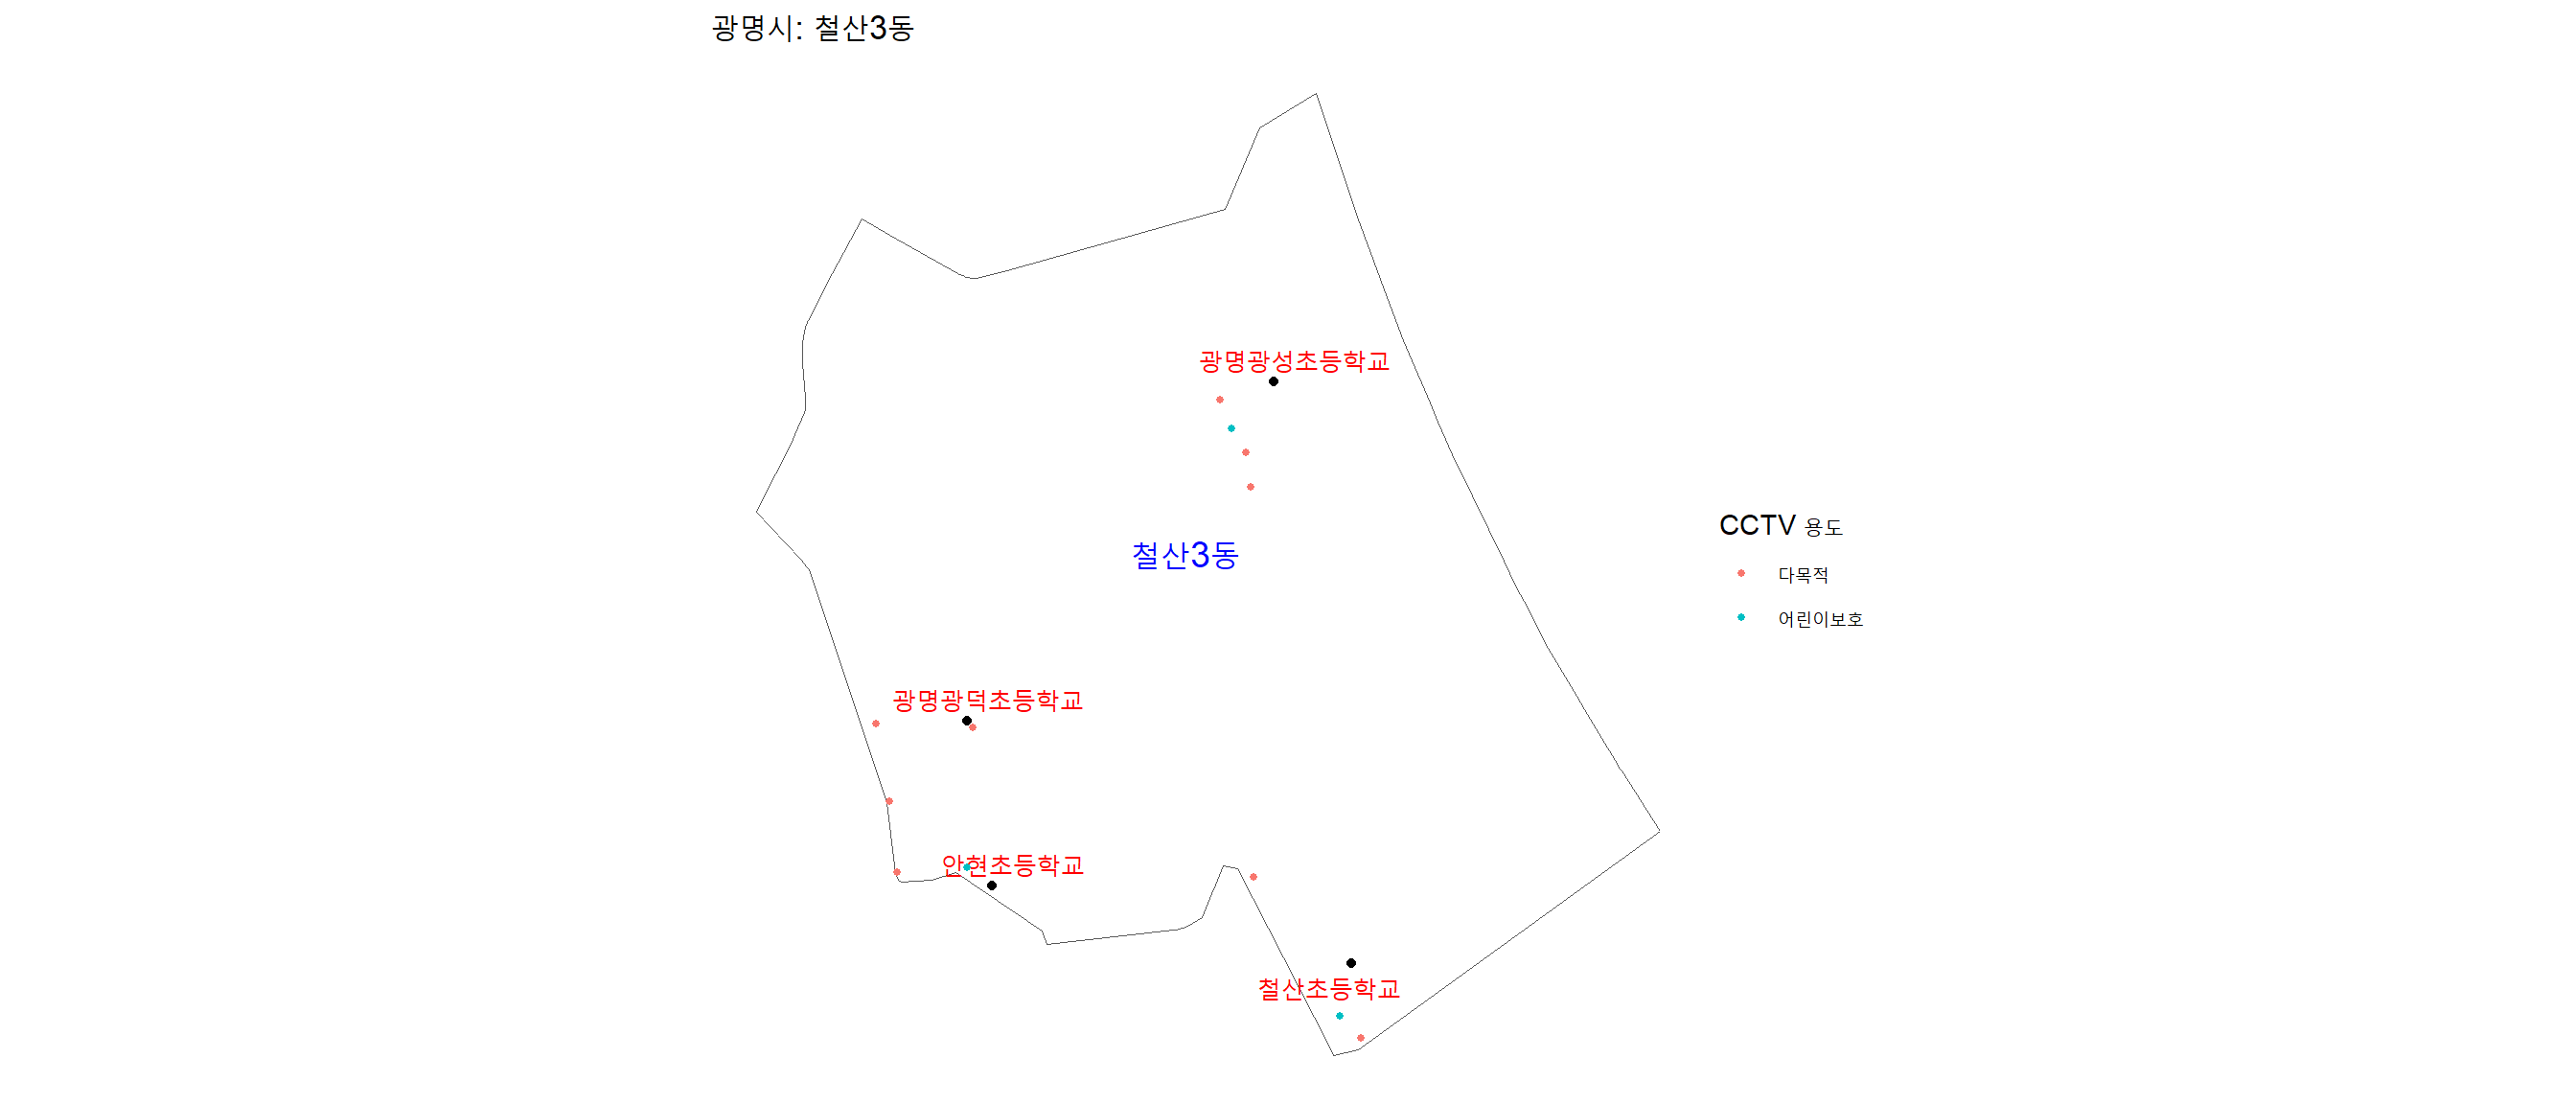
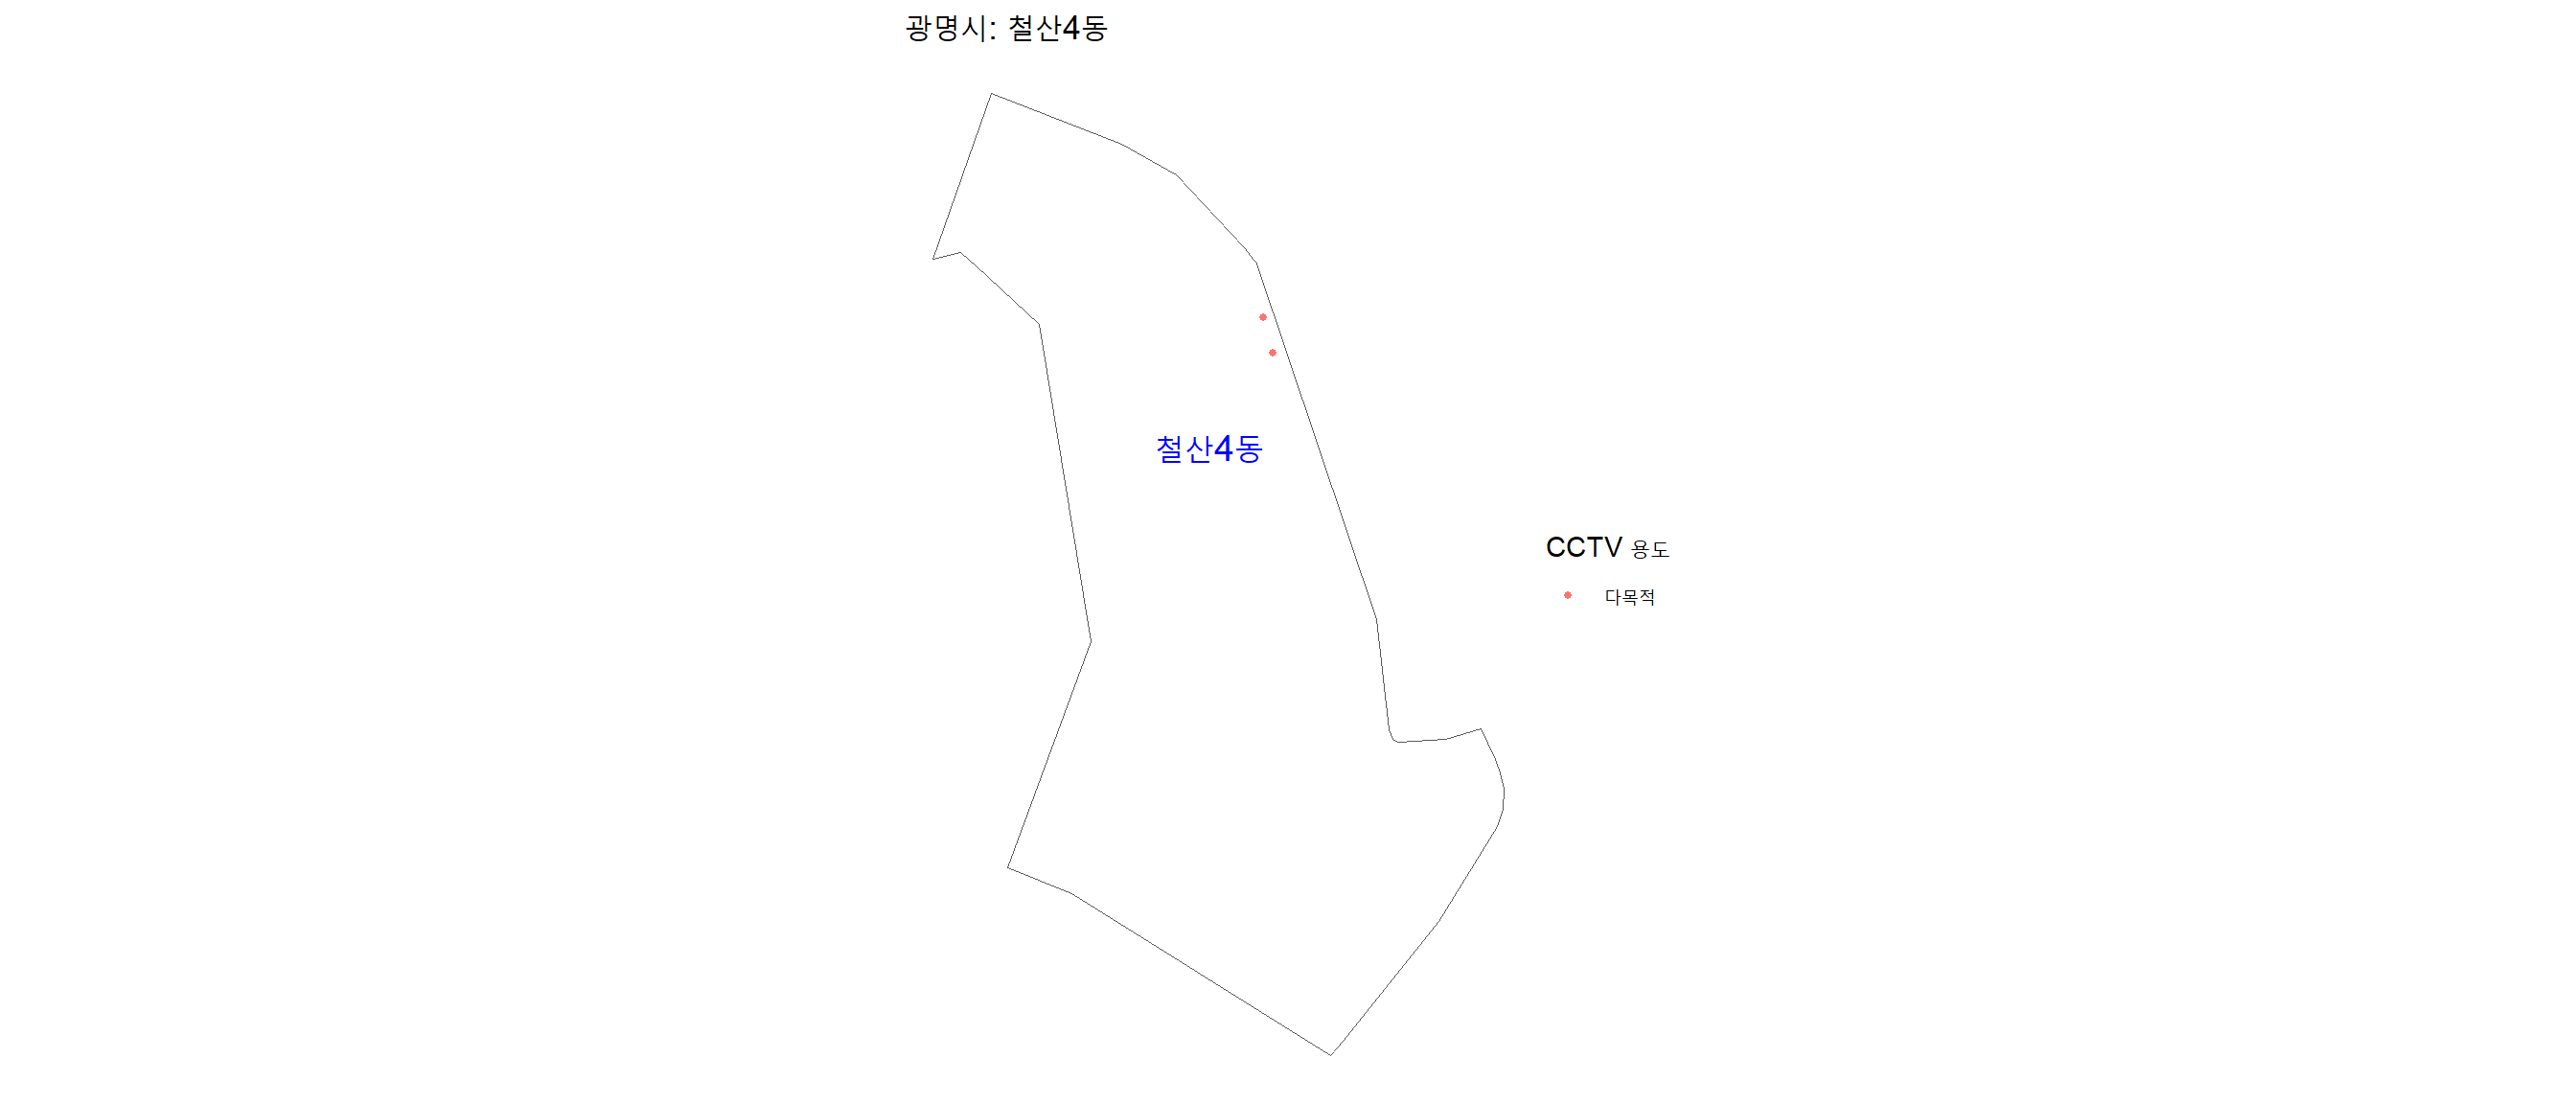
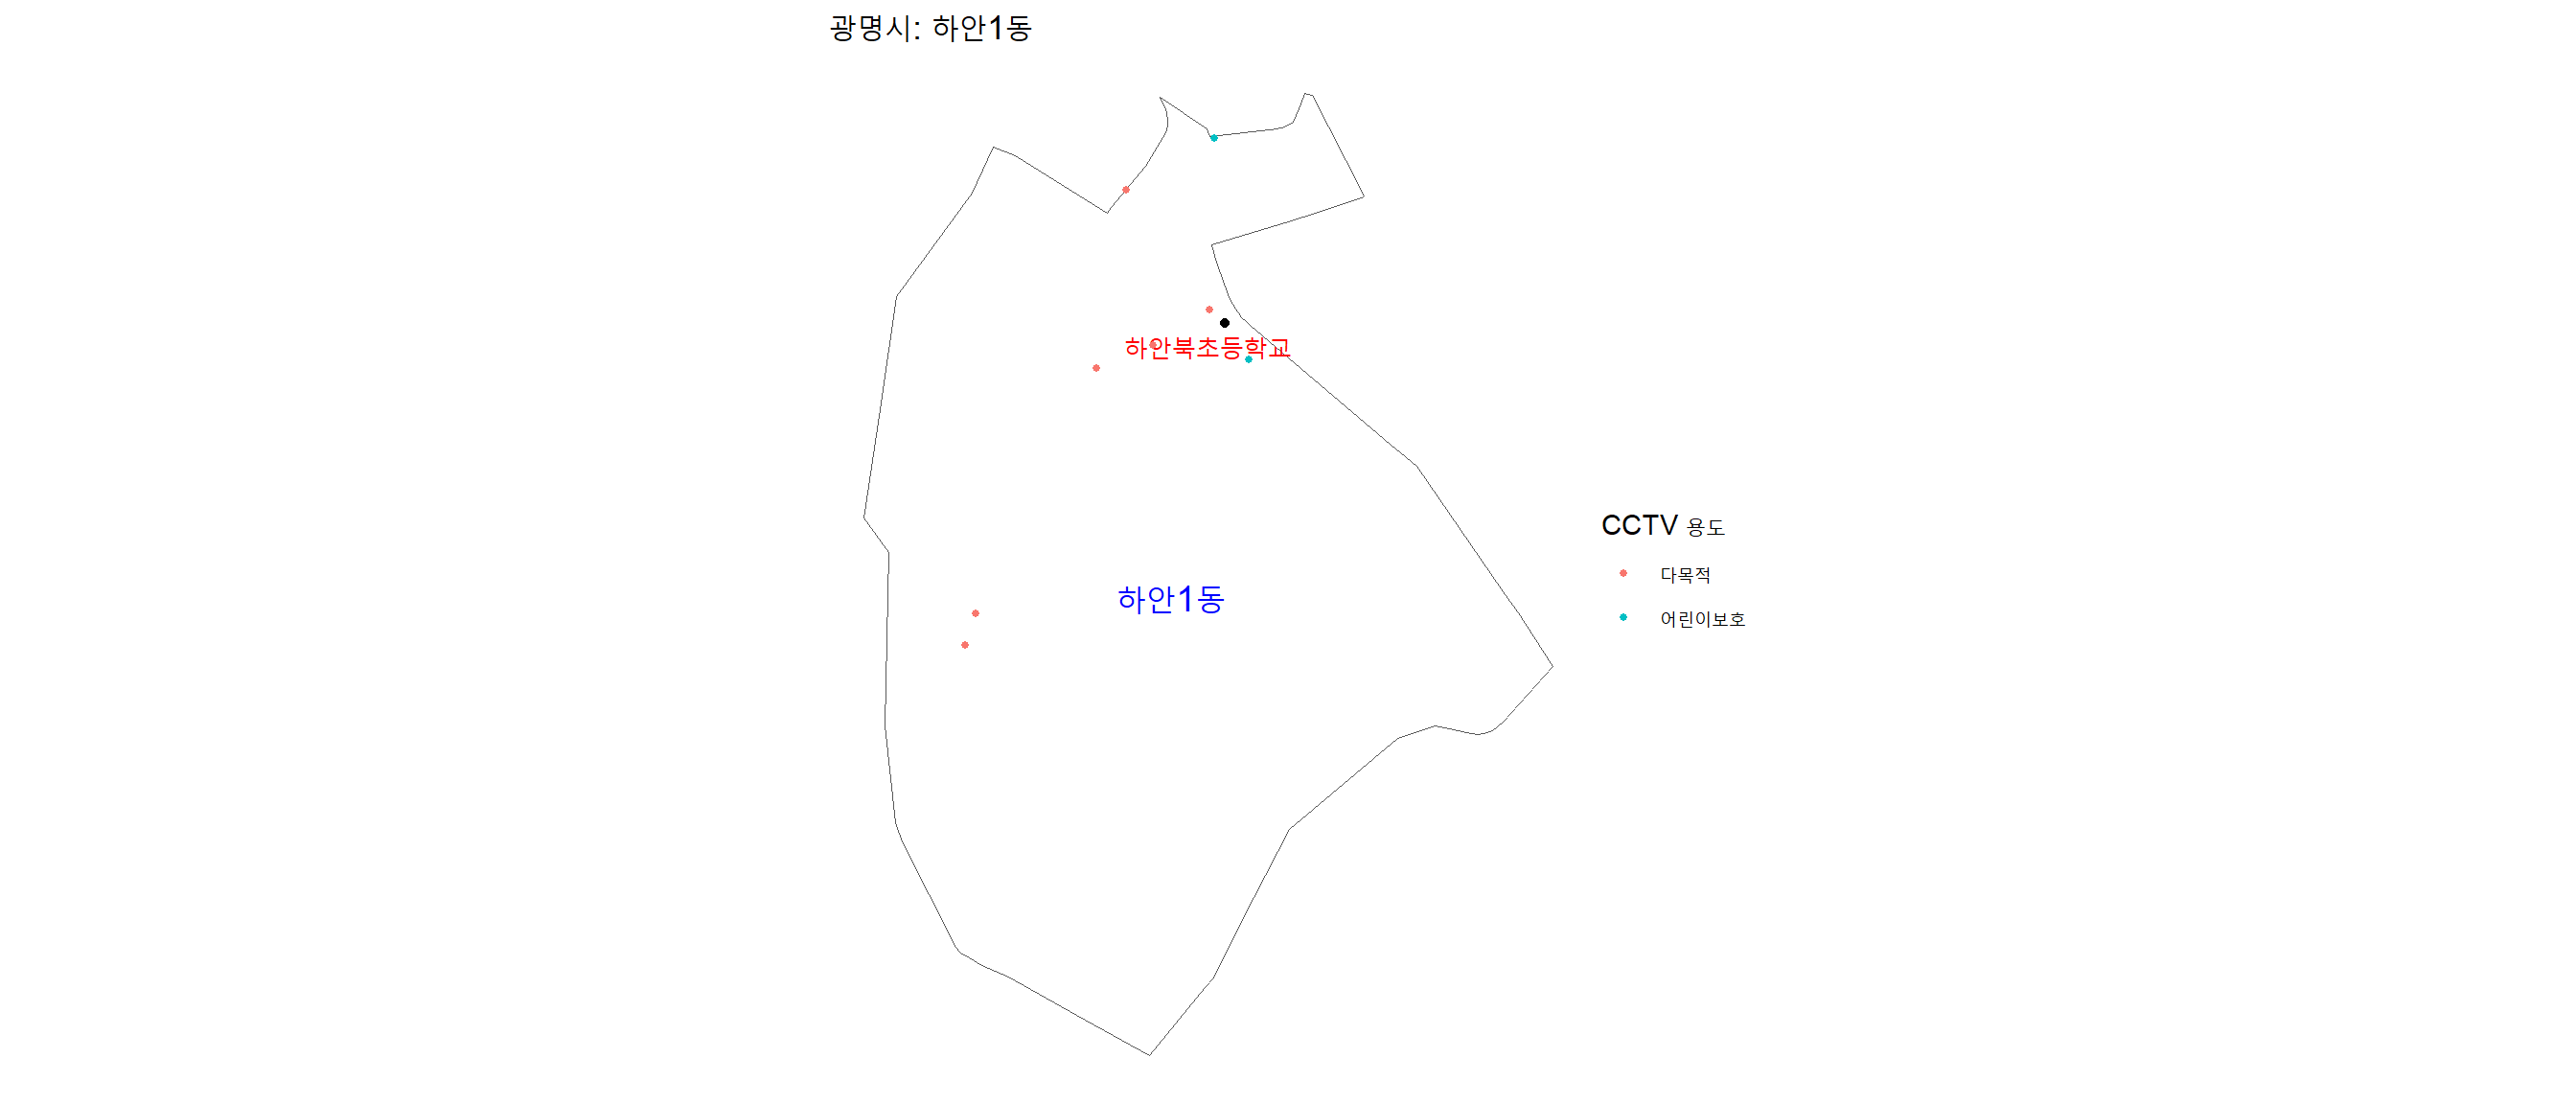
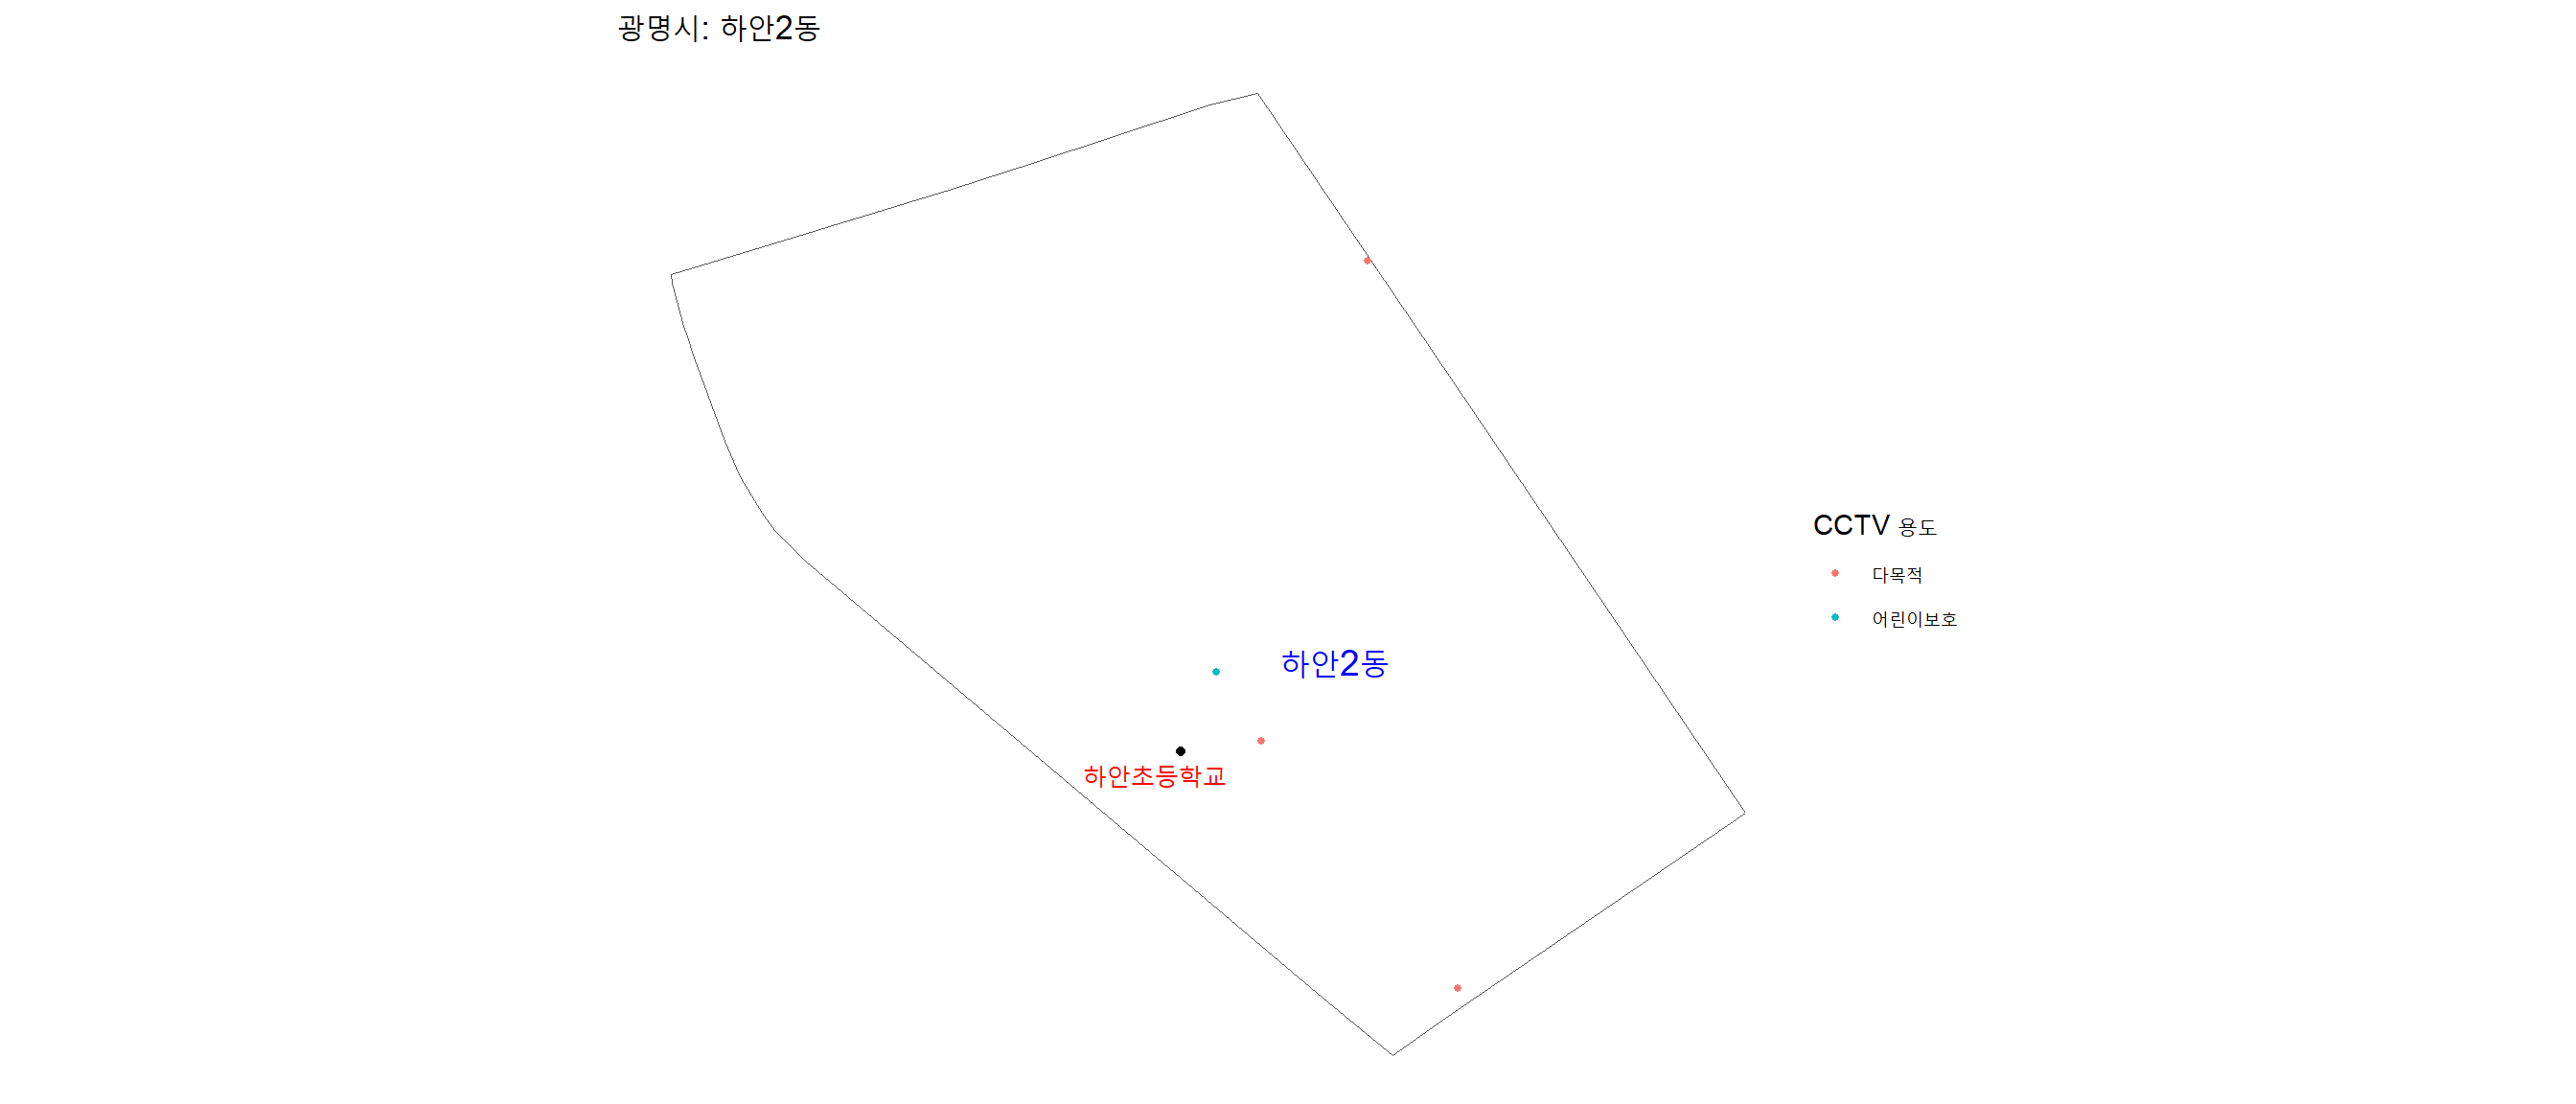
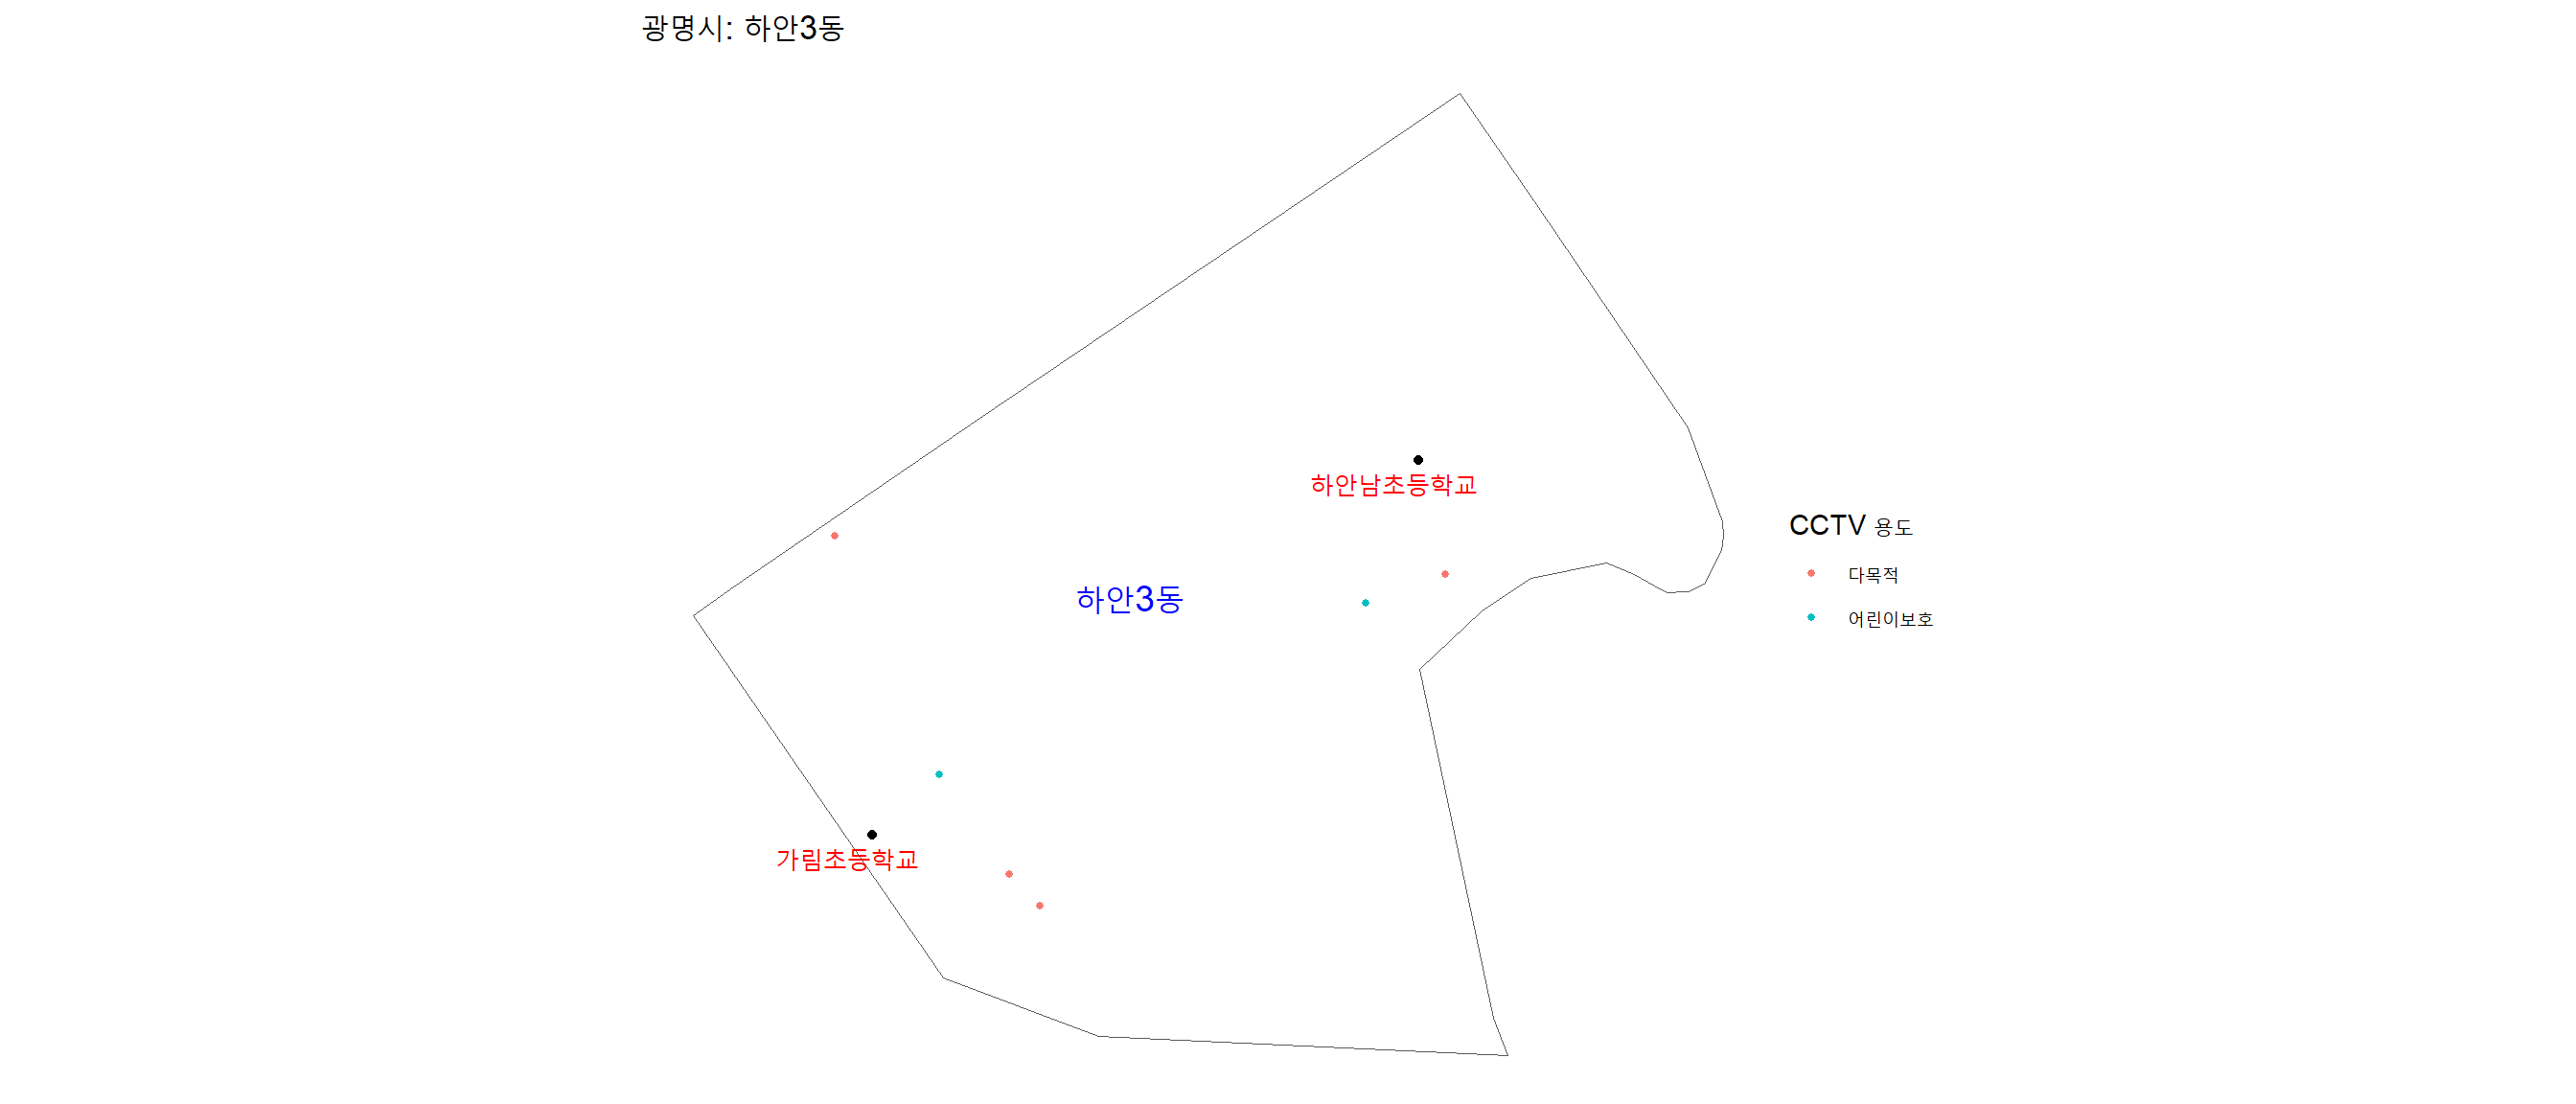
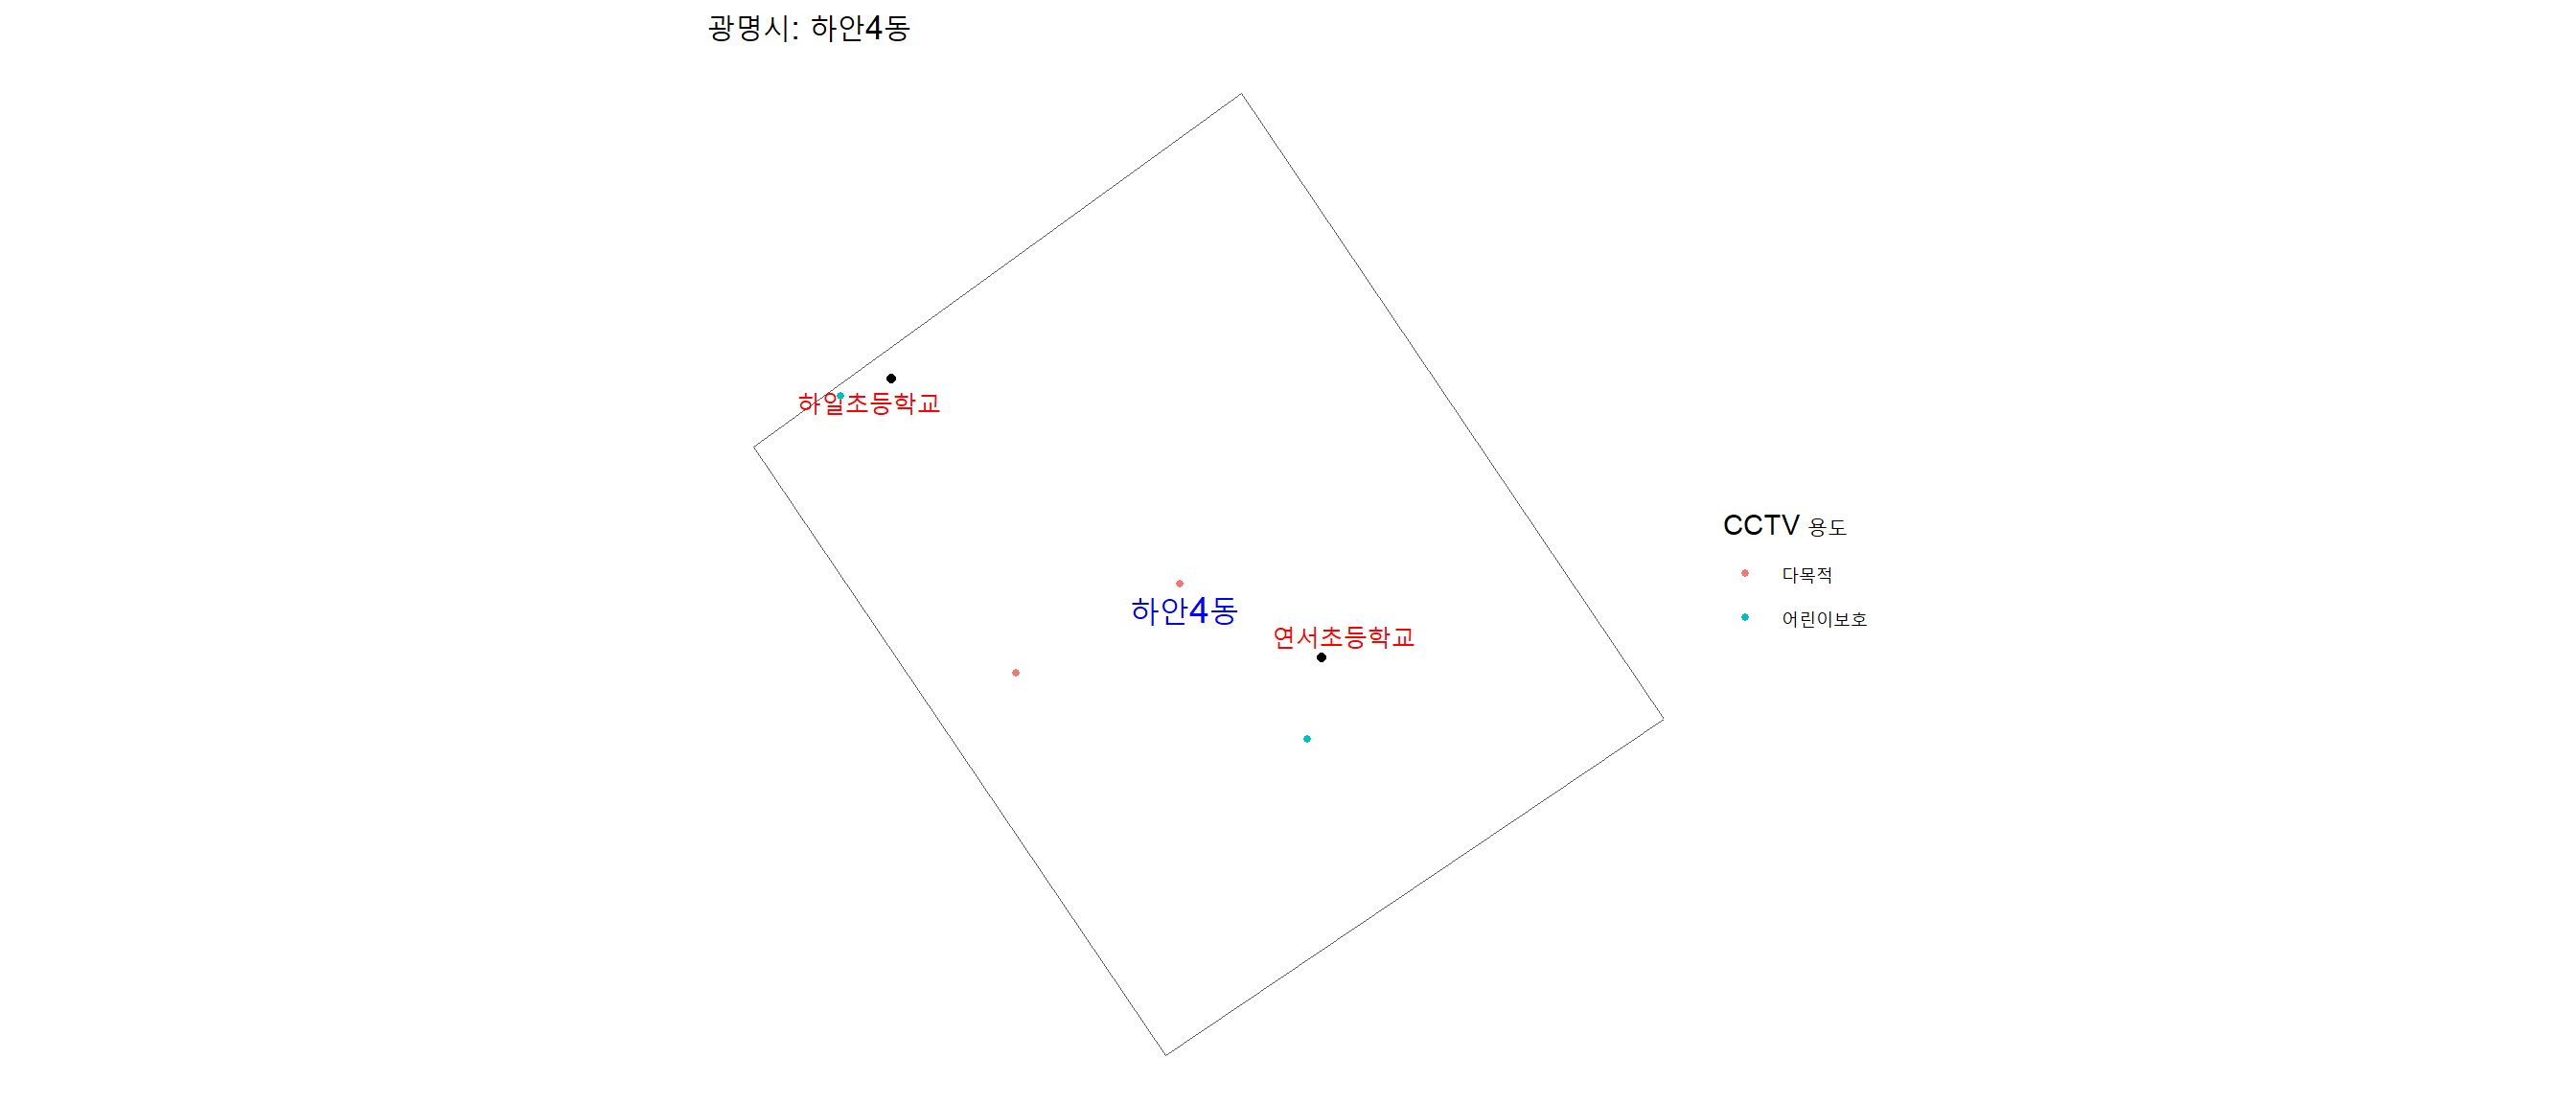
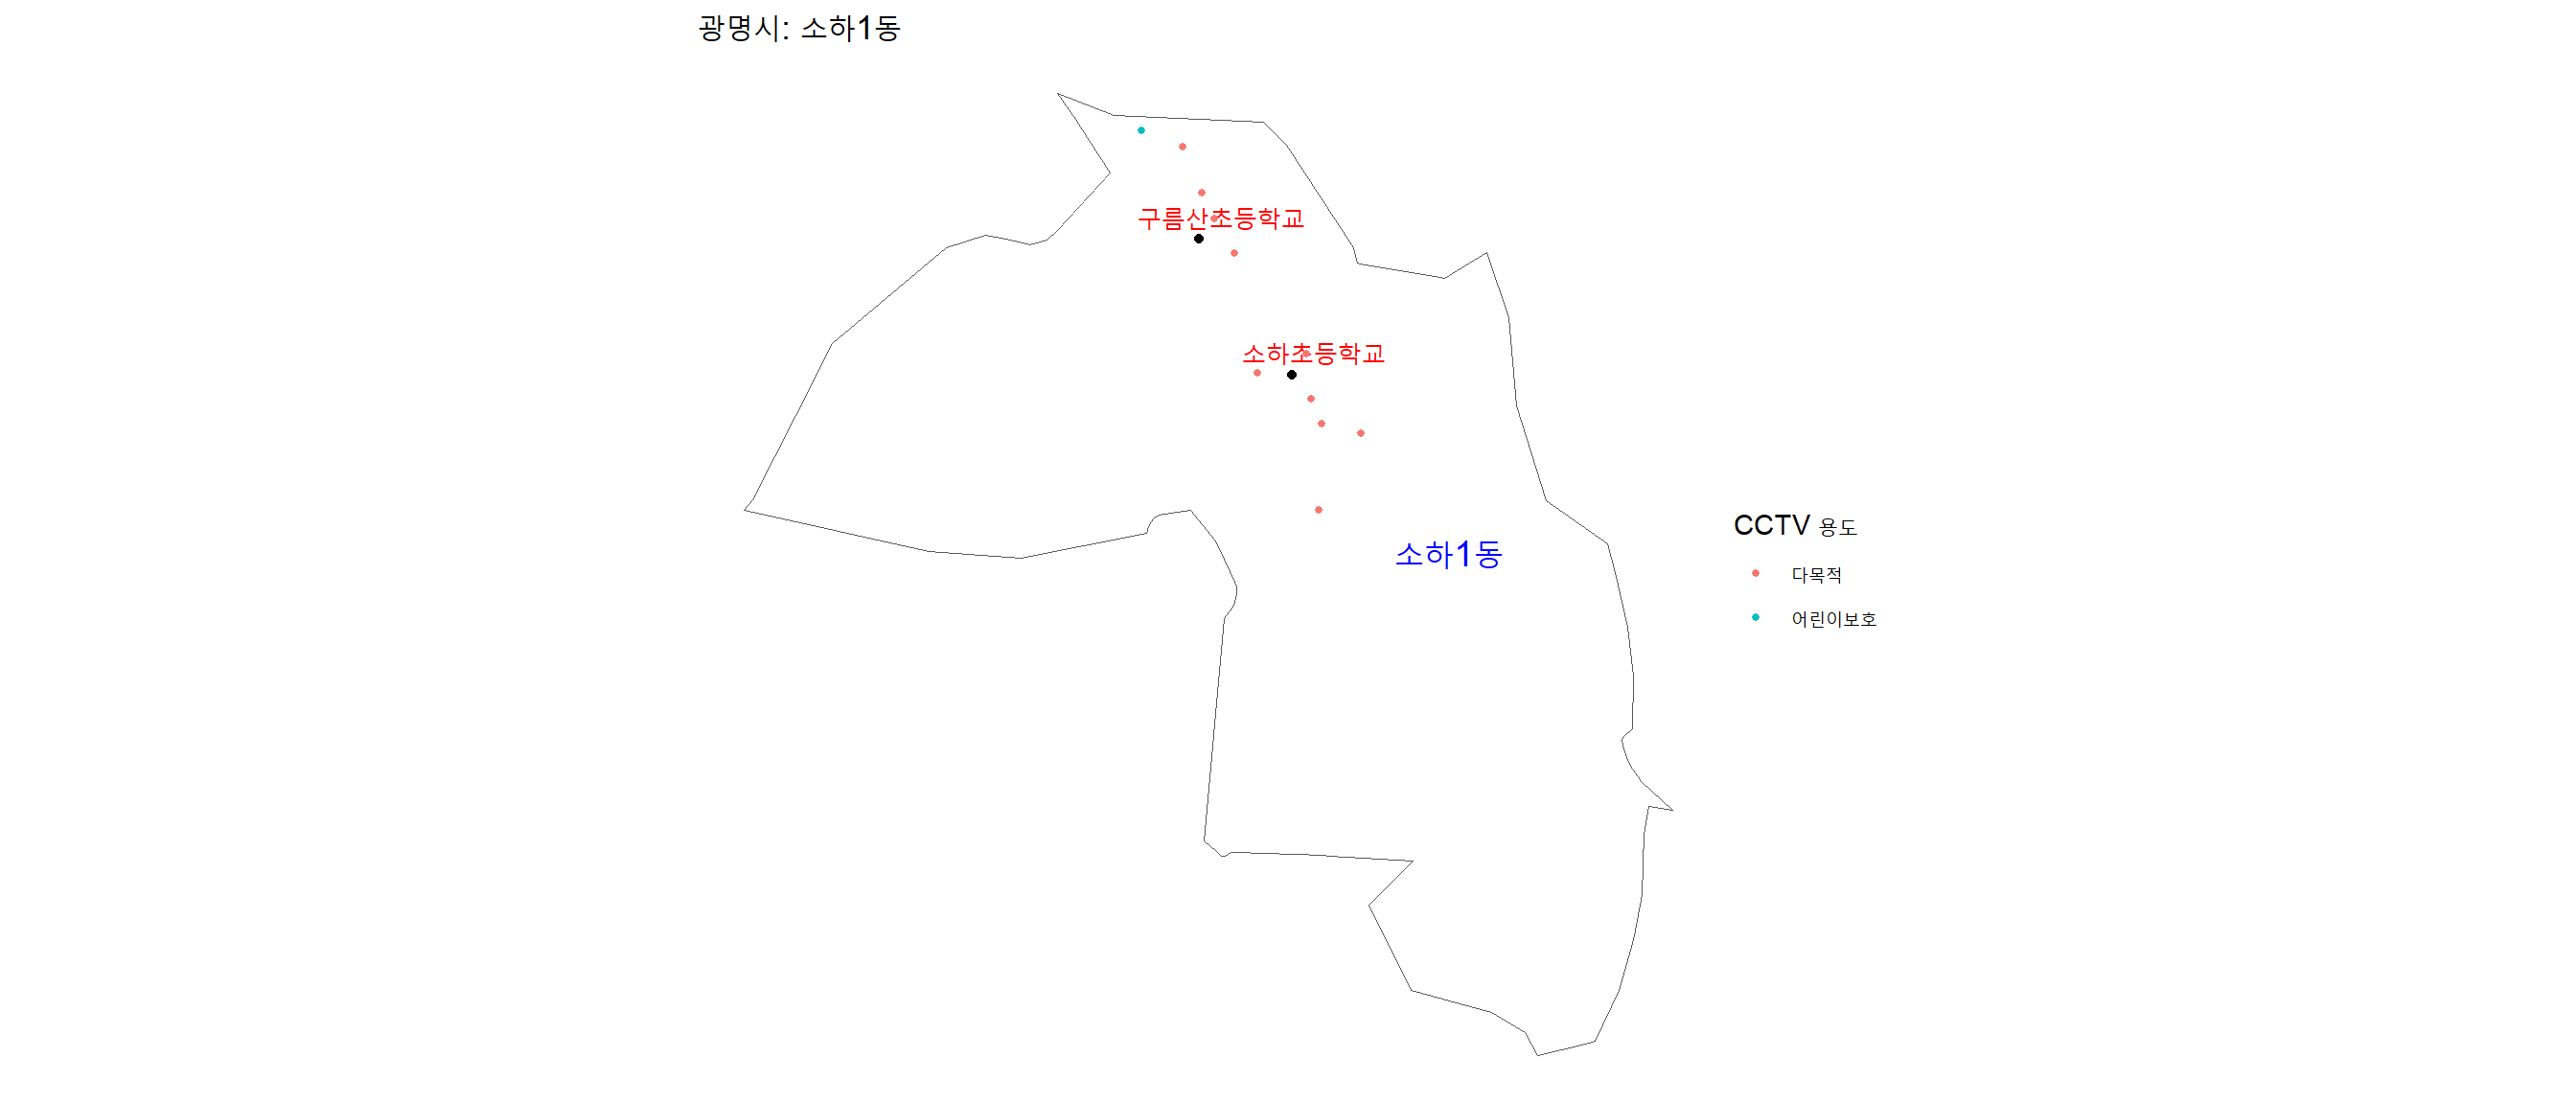
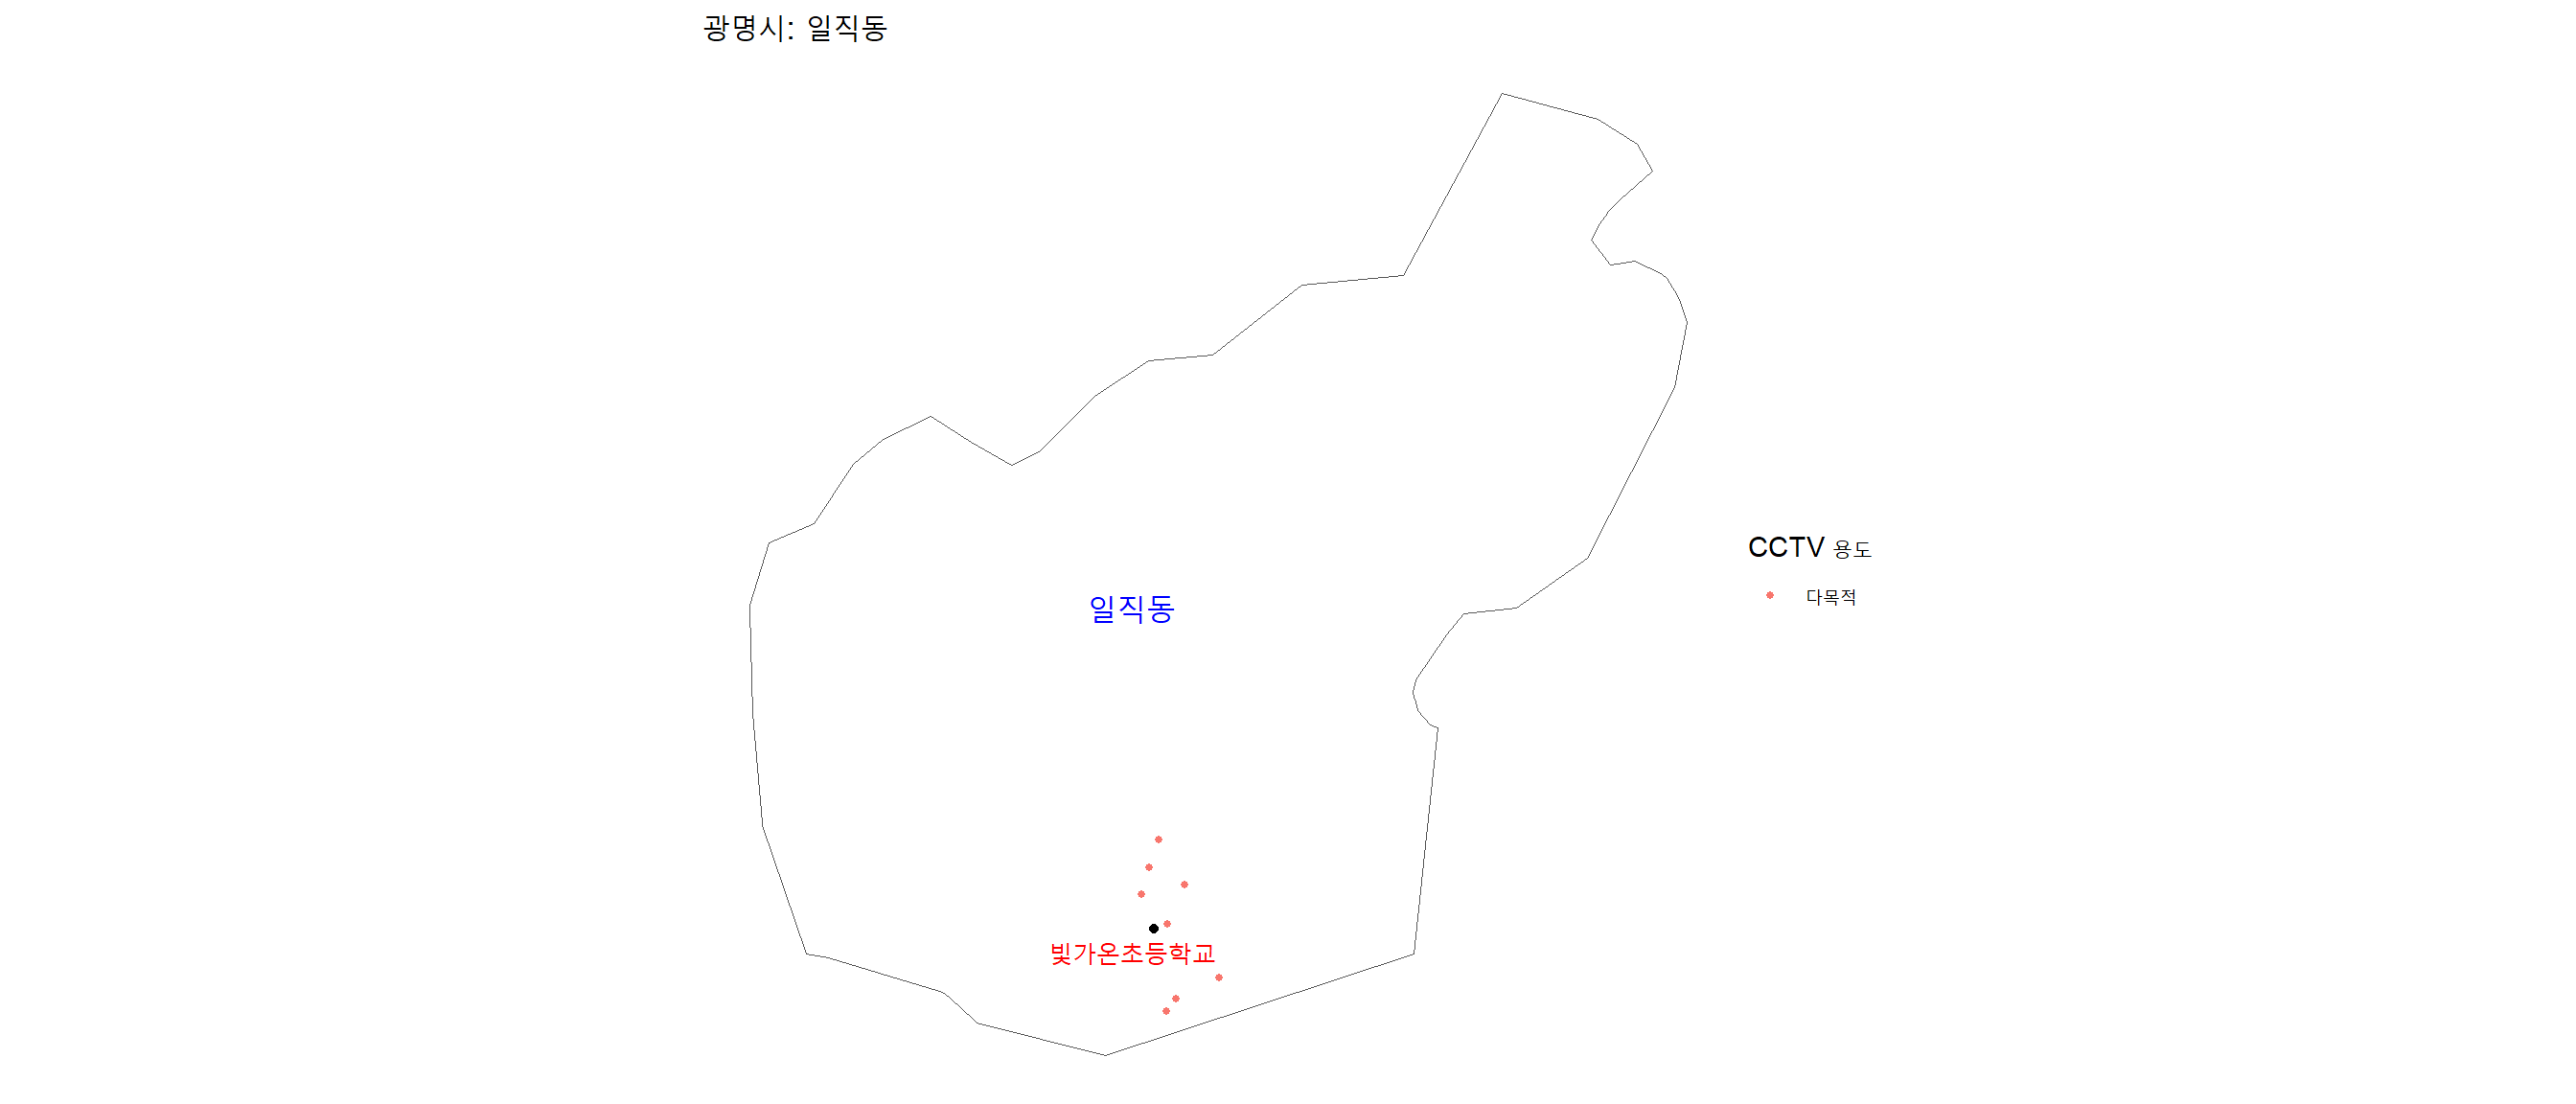
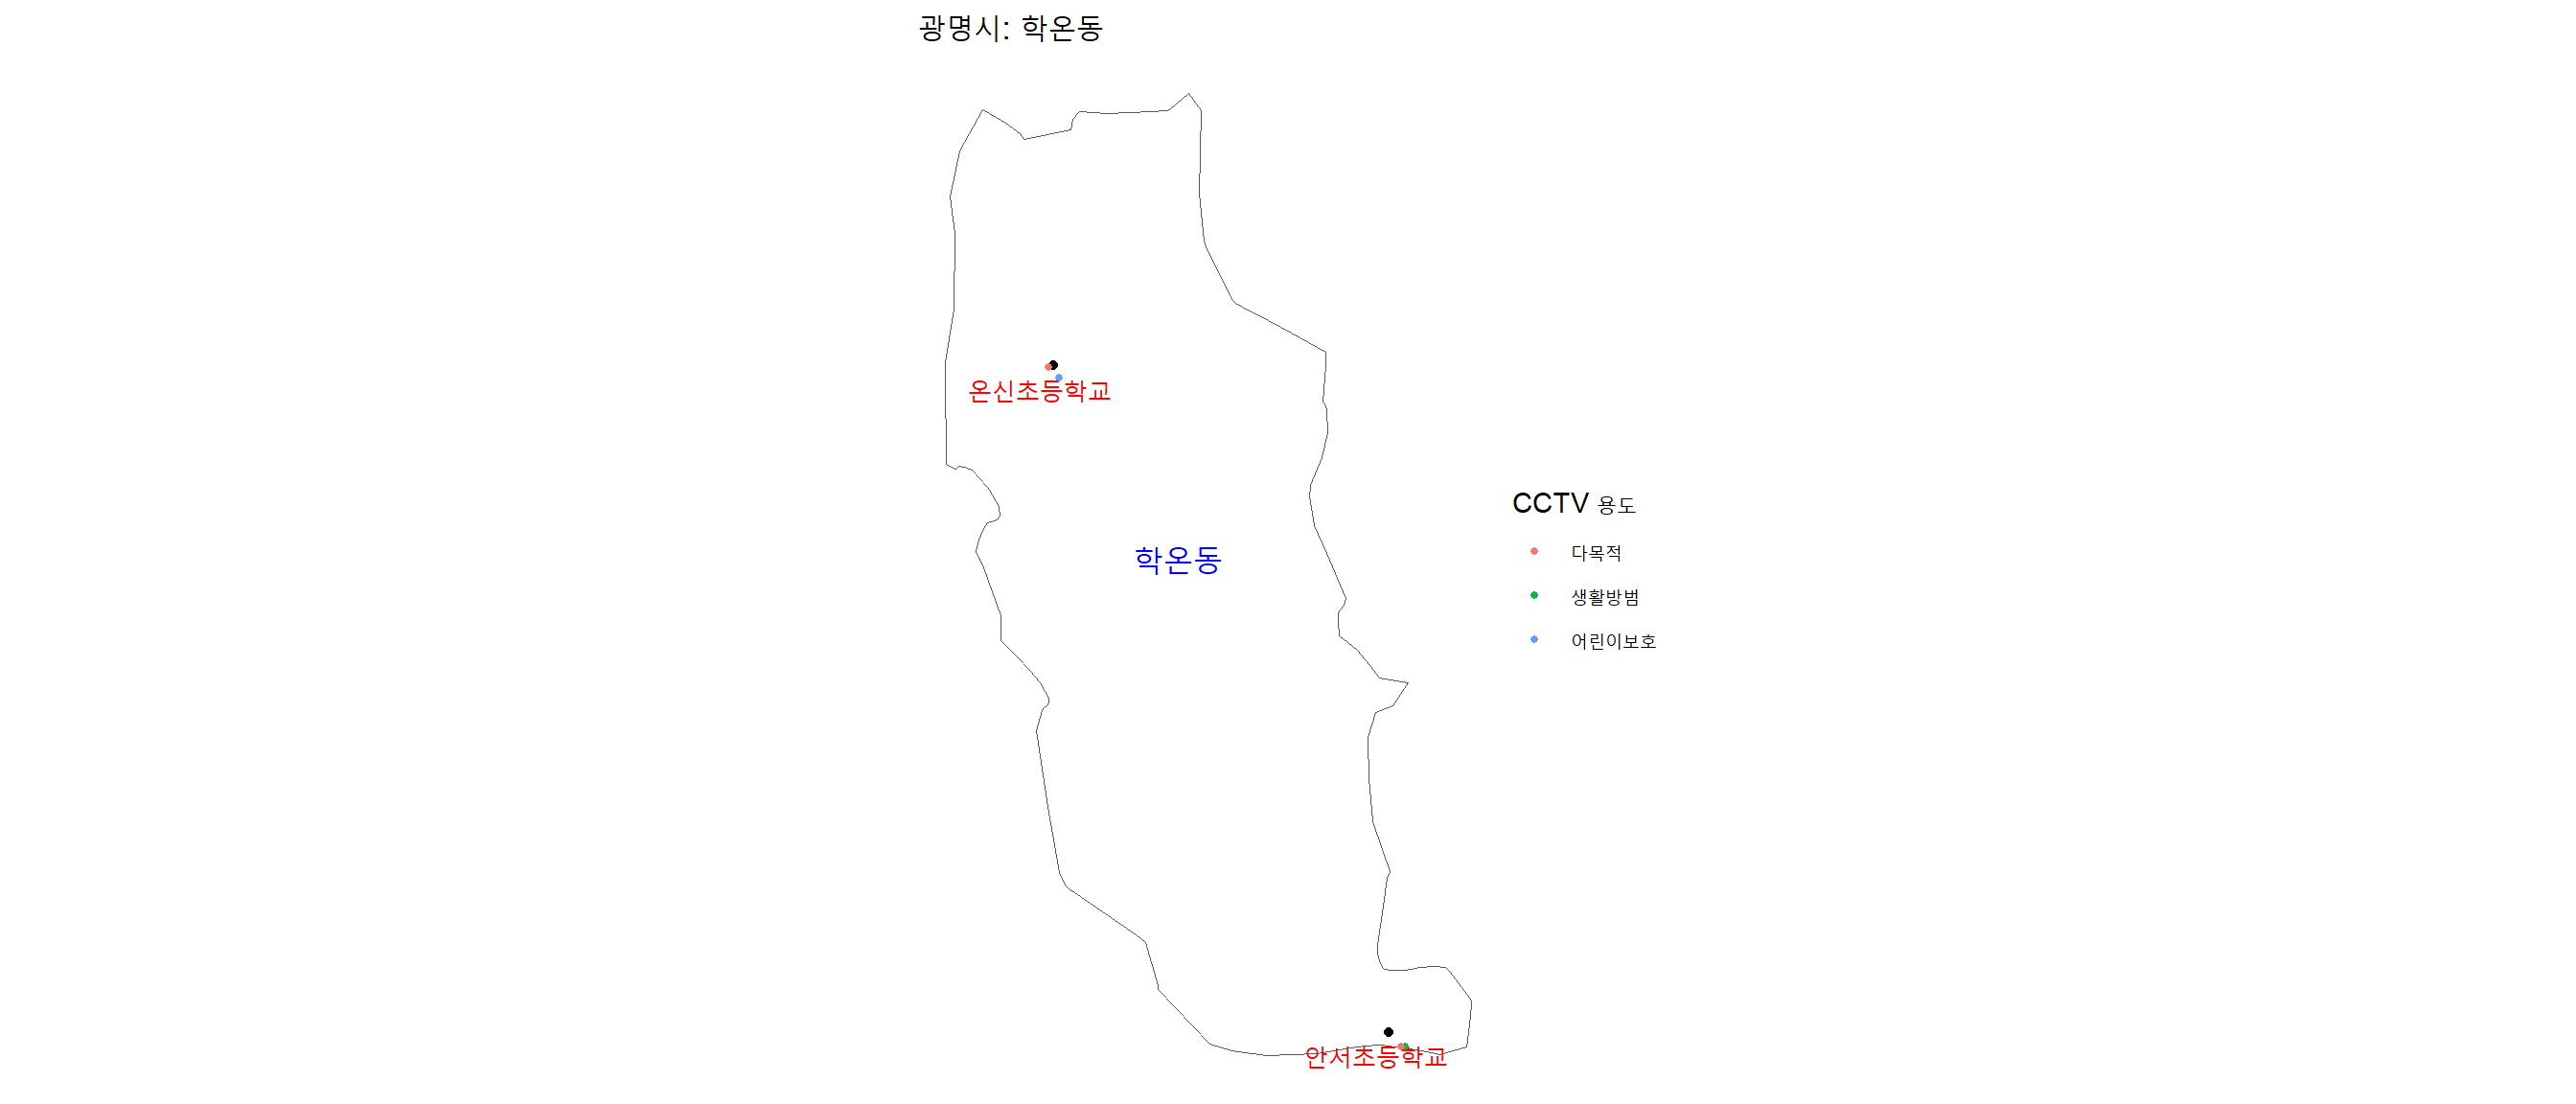
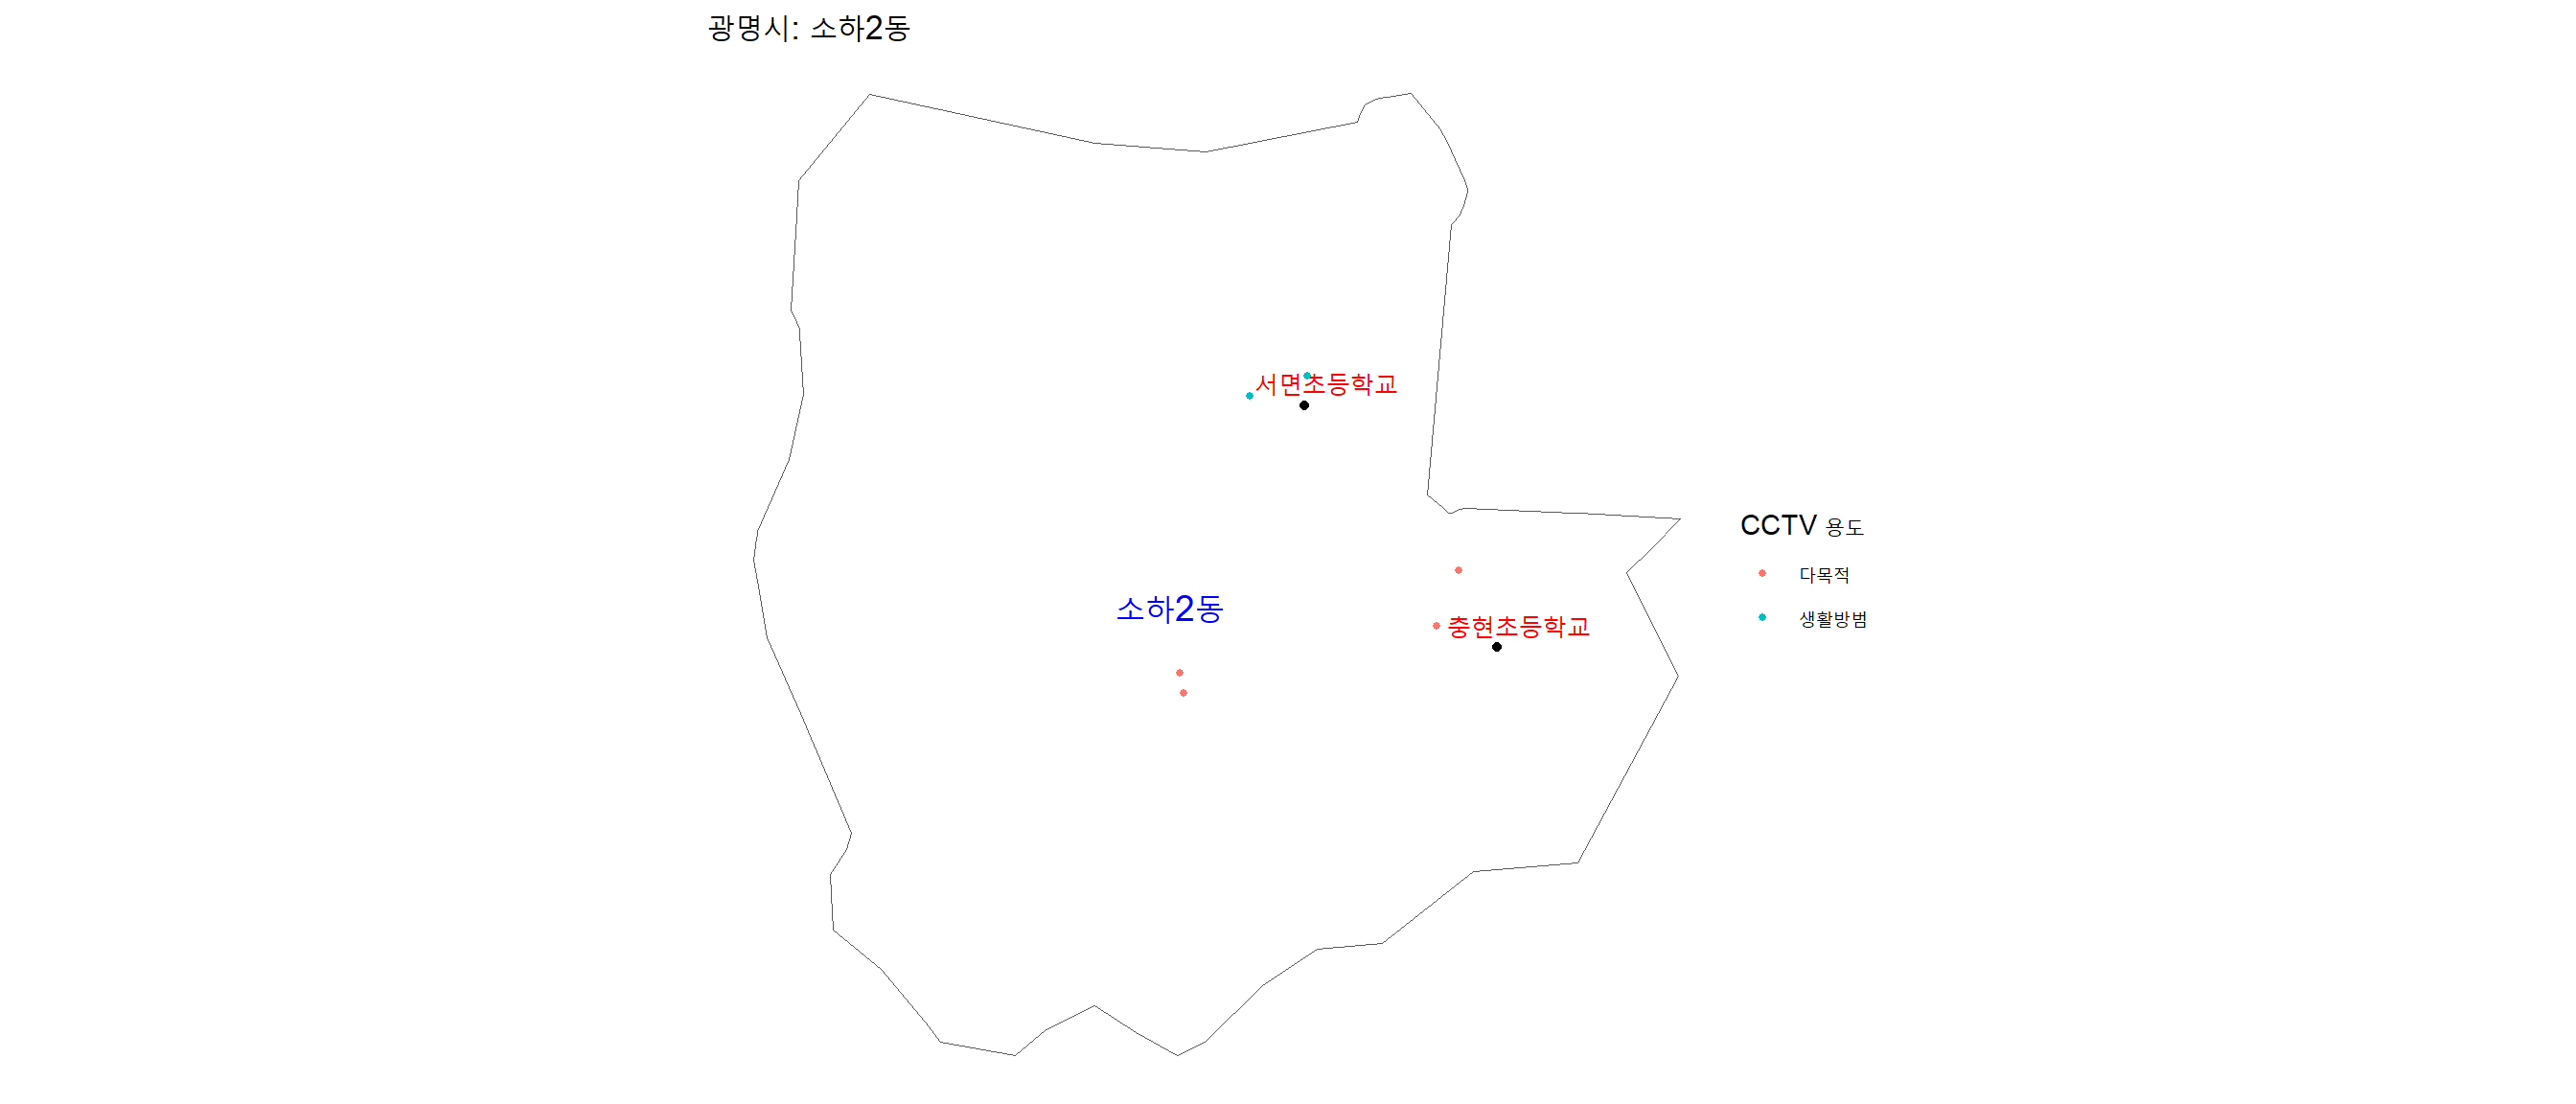
--- title: "경기도 광명시" subtitle: "학교와 CCTV" description: | 공공데이터를 활용하여 학교와 주변 CCTV를 확인한다. author: - name: 이광춘 url: https://www.linkedin.com/in/kwangchunlee/ affiliation: 한국 R 사용자회 affiliation-url: https://github.com/bit2r title-block-banner: true format: html: theme: flatly code-fold: true code-overflow: wrap toc: true toc-depth: 3 toc-title: 목차 number-sections: true highlight-style: github self-contained: false default-image-extension: jpg filters: - lightbox lightbox: auto link-citations: true knitr: opts_chunk: message: false warning: false collapse: true comment: "#>" R.options: knitr.graphics.auto_pdf: true editor_options: chunk_output_type: console --- # 데이터 ## 행정동 코드 [ 행정안전부 주민등록, 인감 ](https://www.mois.go.kr/frt/bbs/type001/commonSelectBoardList.do?bbsId=BBSMSTR_000000000052) 에서 행정기관(행정동) 및 관할구역(법정동) 코드를 다운로드 받을 수 있다.```{r} library (readxl)library (tidyverse)<- read_excel ("data/jsocde20230611/KIKcd_H.20230611.xlsx" )<- admin_code_raw %>% mutate (시도 = str_sub (행정동코드, 1 , 2 ),= str_sub (행정동코드, 1 , 4 ),= str_sub (행정동코드, 1 , 8 )) %>% select (행정동코드, 시도, 시도명, 시군구, 시군구명, 읍면동, 읍면동명) %>% write_rds ("data/admin_code.rds" )``` ## 초등학교 [ 경기데이터드림 ](https://data.gg.go.kr/portal/mainPage.do) 공공데이터 개방포털에서 ```{r} <- read_excel ("data/초․중등학교위치현황(제공표준).xlsx" )## 광명시 초등학교 <- gg_school %>% filter (학교급구분 == "초등학교" ,== "경기도광명교육지원청" ) %>% select (주소 = 소재지도로명주소, 학교명, 경도, 위도, 설립형태, 설립일자) %>% mutate (경도 = as.numeric (경도),= as.numeric (위도))``` ## CCTV 정보 [ 경기도 광명시_어린이보호구역 내 CCTV 정보_API ](https://www.data.go.kr/data/15098625/openapi.do) 를 공공데이터포털에서 다운로드 받는다.```{r} library (sf)<- read_csv ("data/보호구역내cctv정보.csv" , locale= locale ('ko' ,encoding= 'euc-kr' ))<- cctv_raw %>% select (기기번호 = SFZN_ID, 용도 = INST_PURPS, 도로명주소= RDNMADR, 경도, 위도, 설치대수= CCTV_CNT, 일자= REF_DATE)``` ## 지도 [ 국가공간정보포털 ](http://www.nsdi.go.kr/) 을 통해 공간정보 포탈의 역할을 수행하였으나, [ 브이월드 ](https://www.vworld.kr/) 로 통합되고 있다. 브이월드는 공간정보오픈플랫폼으로 기존 국가공간정보포탈을 확장한 것으로 보인다.- 대한민국 행정동 경계(admdongkor): <https://github.com/vuski/admdongkor> - 통계청 (센서스경계)행정동경계: <http://data.nsdi.go.kr/dataset/20171206ds00001> - 국토교통부 행정구역시군구_경계: <http://data.nsdi.go.kr/dataset/15144> - 국토지리정보원 행정경계(시군구): <http://data.nsdi.go.kr/dataset/20180927ds0058> ```{r} library (sf)<- st_read ("data/HangJeongDong_ver20230401.geojson" )<- admin_sf %>% filter (sgg == "41210" ) %>% st_transform (crs = 4326 ) %>% separate (temp, into = c ("구시군" , "읍면동" ), sep = " " )plot (st_geometry (km_sf))``` # 시각화 ## CCTV x 행정동 ```{r} # devtools::install_github("yutannihilation/ggsflabel") library (ggsflabel)<- st_as_sf (cctv_tbl, coords = c ("경도" , "위도" ),crs = 4326 )<- ggplot () + geom_sf (data = cctv_sf, aes (geometry = geometry)) + geom_sf (data = km_sf, aes (geometry = geometry), alpha= 0 ) + theme_void () + geom_sf_label_repel (data = km_sf, aes (label= 읍면동))``` ## CCTV x 행정동 (인터랙티브) ```{r} library (plotly)library (ggiraph)<- glue:: glue ("· 용도: {cctv_sf$용도}<br>" ,"· 일자: {cctv_sf$일자}<br>" ,"· 설치대수: {cctv_sf$설치대수}<br>" ,"· 위치: {cctv_sf$도로명주소}" )<- ggplot () + geom_sf (data = km_sf, aes (geometry = geometry), alpha= 0 ) + geom_sf_interactive (data= cctv_sf, aes (geometry = geometry, tooltip = info, size= as.integer (설치대수),color = 용도), size = 1 ) + geom_sf_text_repel (data = km_sf, aes (label = 읍면동), color= "blue" , size = 2 ) + theme_void () + labs (color = "CCTV 용도" )girafe (ggobj = cctv_admin_plotly)``` # 초등학교 CCTV ## 광명시 현황 ```{r} <- glue:: glue ("· 용도: {cctv_sf$용도}<br>" ,"· 일자: {cctv_sf$일자}<br>" ,"· 설치대수: {cctv_sf$설치대수}<br>" ,"· 위치: {cctv_sf$도로명주소}" )<- st_as_sf (km_school, coords = c ("경도" , "위도" ),crs = 4326 )<- ggplot () + geom_sf (data = km_sf, aes (geometry = geometry), alpha= 0 ) + geom_sf_text_repel (data = km_school_sf, aes (label = 학교명), color= "red" , size = 2 ) + geom_sf (data = km_school_sf, aes (geometry = geometry), alpha= 1 ) + geom_sf_interactive (data= cctv_sf, aes (geometry = geometry, tooltip = info, size= as.integer (설치대수),color = 용도), size = 1 ) + geom_sf_text_repel (data = km_sf, aes (label = 읍면동), color= "blue" , size = 2 ) + theme_void () + labs (color = "CCTV 용도" )girafe (ggobj = cctv_school_plotly)``` ## 동별 ### 스크립트 ```{r} ## 동별지도 <- km_sf %>% filter (읍면동 == "소하1동" )<- st_filter (km_school_sf, km_dong_sf)<- st_filter (cctv_sf, km_dong_sf)## 동별 툴팁 <- glue:: glue ("· 용도: {cctv_dong_sf$용도}<br>" ,"· 일자: {cctv_dong_sf$일자}<br>" ,"· 설치대수: {cctv_dong_sf$설치대수}<br>" ,"· 위치: {cctv_dong_sf$도로명주소}" )ggplot () + ## 행정동 ------------- geom_sf (data = km_dong_sf , aes (geometry = geometry), alpha= 0 ) + geom_sf_text_repel (data = km_dong_sf, aes (label = 읍면동), color= "blue" , size = 2 ) + ## 학교 --------------- geom_sf_text_repel (data = school_dong_sf, aes (label = 학교명), color= "red" , size = 3 ) + geom_sf (data = school_dong_sf, aes (geometry = geometry), alpha= 1 ) + ## CCTV --------------- geom_sf_interactive (data= cctv_dong_sf, aes (geometry = geometry, tooltip = dong_info,size= as.integer (설치대수), color = 용도), size = 1 ) + theme_void () + labs (color = "CCTV 용도" )``` ### 함수 ```{r} <- function (dong_name = "소하1동" ) {## 동별지도 <- km_sf %>% filter (읍면동 == dong_name)<- st_filter (km_school_sf, km_dong_sf)<- st_filter (cctv_sf, km_dong_sf)## 동별 툴팁 <- glue:: glue ("· 용도: {cctv_dong_sf$용도}<br>" ,"· 일자: {cctv_dong_sf$일자}<br>" ,"· 설치대수: {cctv_dong_sf$설치대수}<br>" ,"· 위치: {cctv_dong_sf$도로명주소}" )<- ggplot () + ## 행정동 ------------- geom_sf (data = km_dong_sf , aes (geometry = geometry), alpha= 0 ) + geom_sf_text_repel (data = km_dong_sf, aes (label = 읍면동), color= "blue" , size = 5 ) + ## 학교 --------------- geom_sf_text_repel (data = school_dong_sf, aes (label = 학교명), color= "red" , size = 4 ) + geom_sf (data = school_dong_sf, aes (geometry = geometry), alpha= 1 ) + ## CCTV --------------- geom_sf_interactive (data= cctv_dong_sf, aes (geometry = geometry, tooltip = dong_info,size= as.integer (설치대수), color = 용도), size = 1 ) + theme_void () + labs (color = "CCTV 용도" ,title = glue:: glue ("광명시: {dong_name}" ))# girafe(ggobj = dong_interactive_gg) draw_cctv_shcool_map ("소하1동" )``` ### 전체동 ```{r} <- map (km_sf$ 읍면동, draw_cctv_shcool_map)names (dong_plots) <- km_sf$ 읍면동``` ```{r} #| results: asis #| fig-width: 14 #| fig-height: 6 iwalk (dong_plots, ~ {cat ('### ' , .y, ' \n\n ' )print (.x)cat (' \n\n ' )``` # 학교, 도로, CCTV ## 기본 ```{r} library (leaflet)library (fontawesome)<- km_sf %>% filter (읍면동 == "소하1동" )<- st_filter (km_school_sf, km_dong_sf)<- st_filter (cctv_sf, km_dong_sf)<- awesomeIconList ("다목적" = makeAwesomeIcon (icon = "camera" ,markerColor = "blue" ,library = "fa" ,text = fa ("camera" )"생활방범" = makeAwesomeIcon (icon = "camera" ,markerColor = "green" ,library = "fa" ,text = fa ("camera" )"쓰레기단속" = makeAwesomeIcon (icon = "camera" ,markerColor = "purple" ,library = "fa" ,text = fa ("camera" )"어린이보호" = makeAwesomeIcon (icon = "camera" ,markerColor = "red" ,library = "fa" ,text = fa ("camera" )leaflet (data = cctv_tbl) %>% addProviderTiles (providers$ OpenStreetMap) %>% ## 행정동 addPolygons (data = km_sf, opacity = 1.0 , fillOpacity = 0.0 ,weight = 1 ,highlightOptions = highlightOptions (color = "black" , weight = 3 , bringToFront = TRUE ),label = ~ 읍면동,labelOptions = labelOptions (style = list ("font-weight" = "normal" , padding = "3px 8px" ),textsize = "15px" ,direction = "auto" )) %>% addMarkers (data = km_school, lng= ~ 경도, lat= ~ 위도, clusterOptions = markerClusterOptions (),popup = ~ as.character (paste0 ("<strong>" , ` 학교명 ` , "</strong><br>" ,"--------------------------------<br>" ,"· 주소: " , ` 주소 ` , "<br>" ,"· 설립형태: " , ` 설립형태 ` , "<br>" ,"· 설립일자: " , ` 설립일자 ` ))) %>% addAwesomeMarkers (data = cctv_tbl, lng= ~ 경도, lat= ~ 위도, clusterOptions = markerClusterOptions (),group = ~ 용도,icon = ~ cctv_icons[용도],popup = ~ as.character (paste0 ("<strong>" , 기기번호, "</strong><br>" ,"--------------------------------<br>" ,"· 설치위치: " , ` 도로명주소 ` , "<br>" ,"· 설립대수: " , 설치대수, "<br>" ,"· 용도: " , 용도))) ``` ## 용도별 인터랙티브 [ 참고: [Show/Hide Layers](https://rstudio.github.io/leaflet/showhide.html) ] {.aside}```{r} <- split (cctv_tbl, cctv_tbl$ 용도)<- leaflet () %>% addProviderTiles (providers$ OpenStreetMap)unique (cctv_tbl$ 용도) %>% :: walk ( function (df) {<<- l %>% ## 행정동 addPolygons (data = km_sf, opacity = 1.0 , fillOpacity = 0.0 ,weight = 1 ,highlightOptions = highlightOptions (color = "black" , weight = 3 , bringToFront = TRUE ),label = ~ 읍면동,labelOptions = labelOptions (style = list ("font-weight" = "normal" , padding = "3px 8px" ),textsize = "15px" ,direction = "auto" )) %>% addMarkers (data = km_school, lng= ~ 경도, lat= ~ 위도, clusterOptions = markerClusterOptions (),popup = ~ as.character (paste0 ("<strong>" , ` 학교명 ` , "</strong><br>" ,"--------------------------------<br>" ,"· 주소: " , ` 주소 ` , "<br>" ,"· 설립형태: " , ` 설립형태 ` , "<br>" ,"· 설립일자: " , ` 설립일자 ` ))) %>% addAwesomeMarkers (data = cctv_tbl_split[[df]], lng= ~ 경도, lat= ~ 위도, clusterOptions = markerClusterOptions (),group = df,icon = ~ cctv_icons[용도],popup = ~ as.character (paste0 ("<strong>" , 기기번호, "</strong><br>" ,"--------------------------------<br>" ,"· 설치위치: " , ` 도로명주소 ` , "<br>" ,"· 설립대수: " , 설치대수, "<br>" ,"· 용도: " , 용도)))%>% addLayersControl (overlayGroups = unique (cctv_tbl$ 용도),options = layersControlOptions (collapsed = FALSE )``` ## PPT ```{r} %>% write_rds ("data/km_cctv_tbl.rds" )%>% write_rds ("data/km_km_sf.rds" )%>% write_rds ("data/km_km_school.rds" )``` # 교통사고 통계 ## 어린이 교통사고 [ 어린이 교통사고건수(시도/시/군/구) ](https://kosis.kr/statHtml/statHtml.do?orgId=101&tblId=DT_1YL202107) 에서 광명시만 특정하여 데이터를 추출한다.```{r} library (readxl)<- read_excel ("data/어린이_교통사고건수_시도_시_군_구__20230624195028.xlsx" , sheet = "데이터" ,skip = 2 )<- accident_raw %>% select (1 , 5 : 7 ) %>% set_names (c ("시점" , "사고건수" , "사망자수" , "부상자수" )) %>% mutate_all (as.integer) %>% pivot_longer (cols= - 시점, names_to = "구분" , values_to = "건수" ) %>% mutate (건수 = ifelse (is.na (건수), 0 , 건수))``` ```{r} :: loadfonts ()%>% ggplot (aes (x = 시점, y= 건수, color = 구분)) + geom_line () + geom_point () + labs (title = "광명시 어린이 교통사고건수" ,x = "" ,y = "교통사고건수" ,caption = "출처: KOSIS https://kosis.kr/statHtml/statHtml.do?orgId=101&tblId=DT_1YL202107" ) + theme_minimal (base_family = "MaruBuri" )``` ## 어린이 교통사고 [ 교통사고 GIS 분석시스템 ](https://taas.koroad.or.kr/web/shp/sbm/initGisAnals.do?menuId=WEB_KMP_GIS_TAS) 에서 2014~2022년 사이 경기도 광명시 "보행 어린이 사고"를 특정하여 분석한다.```{r} library (janitor)library (gt)library (gtExtras)<- read_excel ("data/km_accident_2014_2016.xlsx" )<- read_excel ("data/km_accident_2017_2019.xlsx" )<- read_excel ("data/km_accident_2020_2022.xlsx" )<- bind_rows (accident_2016, accident_2019) %>% bind_rows (accident_2022)%>% group_by (사고유형) %>% summarize (사망자수 = sum (사망자수),= sum (중상자수),= sum (경상자수)) %>% adorn_totals (where = "row" , name = "합계" ) %>% adorn_totals (where = "col" , name = "합계" ) %>% ## 표 :: gt () %>% tab_header (title = md ("광명시 **보행 어린이** 교통사고" ),subtitle = md ("`TAAS` 교통사고분석시스템 (2014~2022)" )%>% :: cols_align (align = "center" ) %>% tab_spanner (label = "교통사고 어린이 구분" ,columns = c (%>% gt_theme_538 () %>% gt_highlight_rows (rows = 사고유형 == "차대사람 - 횡단중" ,fill = "lightgrey" ,bold_target_only = TRUE ,target_col = everything ()``` 


