코드
import camelot

# PDF 파일에서 표를 읽어옵니다.
tables = camelot.read_pdf('data/민간데이터 목록.pdf', pages='1')

tables_pd = tables[0].df

# 데이터프레임을 CSV 파일로 저장합니다.
# df.to_csv('output.csv', index=False)import camelot
# PDF 파일에서 표를 읽어옵니다.
tables = camelot.read_pdf('data/민간데이터 목록.pdf', pages='1')
tables_pd = tables[0].df
# 데이터프레임을 CSV 파일로 저장합니다.
# df.to_csv('output.csv', index=False)library(reticulate)
library(tidyverse)
library(gt)
library(gtExtras)
dataset <- py$tables_pd
dataset |>
as_tibble() |>
janitor::row_to_names(1) |>
relocate(제공기관, .before = 분석구분) |>
gt(groupname_col = "제공기관") |>
gt_theme_538() |>
tab_options(
heading.title.font.size = px(16L),
column_labels.font.size = px(14L),
table.font.size = px(12L)
) |>
cols_align("center")| 분석구분 | 데이터 내역 | 제공 단위 | 시간범위 | 제공형태 | 제공시작일 |
|---|---|---|---|---|---|
| 오픈메이트 | |||||
| 공통 | 행정동 경계 | 행정동 | - | shp | ‘20.9.17 |
| 공통 | 블록 경계 | 블록 | - | shp | ‘20.9.17 |
| 공통 | 셀/블록/행정동 매핑 | 50m X 50m | - | csv | ‘20.9.17 |
| 공통 | 셀(중심점) | 50m X 50m | - | shp | ‘20.9.17 |
| 공통 | 셀(격자) | 50m X 50m | - | shp | ‘20.9.17 |
| 공통 | 도로단위 | 도로 | - | shp | ‘20.9.17 |
| 비씨카드 | |||||
| 카드 | 성별 / 연령별 카드매출 | 블록 | 2017년1월~ 2023년02월 | txt,csv | ‘20.7.17 |
| 카드 | 유입지별카드매출 | 행정동 | 2017년1월~ 2023년02월 | txt,csv | ‘20.7.17 |
| 카드 | 가맹점정보 | 블록 | 2017년1월~ 2023년02월 | txt,csv | ‘20.7.17 |
| 카드 | 가맹점별카드매출 | 블록 | 2017년1월~ 2023년02월 | txt,csv | ‘20.7.17 |
| 카드 | 요일별카드매출 | 블록 | 2017년1월~ 2023년02월 | txt,csv | ‘20.7.17 |
| 카드 | 시간대별카드매출 | 블록 | 2017년1월~ 2023년02월 | txt,csv | ‘20.7.17 |
| KT | |||||
| 격자별 유동인구 | 성연령별 / 시간대별 유동인구 | 격자 | 2017년6월~ 2022년12월 | csv | ‘20.7.30 |
| 격자별 유동인구 | 성연령별 유동인구 | 격자 | 2017년6월~ 2022년12월 | csv | ‘20.7.30 |
| 격자별 유동인구 | 요일별 유동인구 | 격자 | 2017년6월~ 2022년12월 | csv | ‘20.7.30 |
| 격자별 유동인구 | 시간대별 유동인구 | 격자 | 2017년6월~ 2022년12월 | csv | ‘20.7.30 |
| 도로별 유동인구 | 성연령별 / 시간대별 유동인구 | 도로 | 2017년6월~ 2022년12월 | csv | ‘20.7.30 |
| 도로별 유동인구 | 성연령별 유동인구 | 도로 | 2017년6월~ 2022년12월 | csv | ‘20.7.30 |
| 도로별 유동인구 | 요일별 유동인구 | 도로 | 2017년6월~ 2022년12월 | csv | ‘20.7.30 |
| 도로별 유동인구 | 시간대별 유동인구 | 도로 | 2017년6월~ 2022년12월 | csv | ‘20.7.30 |
extrafont::loadfonts()

amt_files <- fs::dir_ls("data/BC카드데이터/TBSH_GYEONGGI_SELNG/")

amt_raw <- amt_files %>%
  enframe() %>%
  mutate(data = map(value, read_delim)) %>%
  select(name, data) %>%
  mutate(name = str_extract(name, "\\d+\\.txt$")) %>%
  unnest(data)

amt_tbl <- amt_raw %>%
  janitor::clean_names() %>%
  mutate(ta_ym = lubridate::ym(ta_ym))

monthly_amt_tbl <- amt_tbl %>%
  group_by(ta_ym) %>%
  summarize(결재건수 = sum(total_cnt, na.rm=TRUE)/10^4,
            결재금액 = sum(total_amt, na.rm=TRUE)/10^8)

monthly_amt_gg <- monthly_amt_tbl %>%
  pivot_longer(-ta_ym) %>%
  ggplot() +
    geom_line(aes(x = ta_ym, y = value, color = name))  +
    facet_wrap(~name, scales = "free_y") +
    theme_bw(base_family = "MaruBuri") +
    labs(x="", y= "",
         title = "경기도 카드 매출 추세",
         subtitle = "BC 카드 월별 결재건수(단위: 만건)와 금액(단위:억원)",
         caption = "출처: 경기도 데이터분석포털 민간 데이터셋") +
    scale_y_continuous(labels = scales::comma) +
    theme(legend.position = "none")

monthly_amt_gg

ragg::agg_png("images/BC/카드매출_월별_매출_건수_추세.png",
              width = 10, height = 7, units = "in", res = 600)
monthly_amt_gg
dev.off()
monthly_type_amt_tbl <- amt_tbl %>%
  group_by(ta_ym) %>%
  summarize(개인건수 = sum(indv_cnt, na.rm=TRUE)/10^4,
            개인금액 = sum(indv_amt, na.rm=TRUE)/10^8,
            법인건수 = sum(entp_cnt, na.rm=TRUE)/10^4,
            법인금액 = sum(entp_amt, na.rm=TRUE)/10^8)

monthly_type_amt_gg <- monthly_type_amt_tbl %>%
  pivot_longer(-ta_ym) %>%
  mutate(구분 = ifelse(str_detect(name, "개인"), "개인카드", "법인카드"),
         금액건수 = ifelse(str_detect(name, "건수"), "건수", "금액")) %>%
  ggplot() +
    geom_line(aes(x = ta_ym, y = value, color = 구분))  +
    facet_wrap(~금액건수, scales = "free_y") +
    theme_bw(base_family = "MaruBuri") +
    labs(x="", y= "",
         title = "경기도 카드 매출 추세",
         subtitle = "BC 카드 월별 카드유형별 결재건수(단위: 만건)와 금액(단위:억원)",
         caption = "출처: 경기도 데이터분석포털 민간 데이터셋") +
    scale_y_sqrt(labels = scales::comma) +
    theme(legend.position = "top") +
    scale_color_manual(values = c("blue", "red")) +
    scale_x_date(breaks = "1 year", minor_breaks = "3 months",
                 date_labels = "%Y")

monthly_type_amt_gg

ragg::agg_png("images/BC/카드매출_월별_카드유형_매출_건수_추세.png",
              width = 10, height = 7, units = "in", res = 600)
monthly_type_amt_gg
dev.off()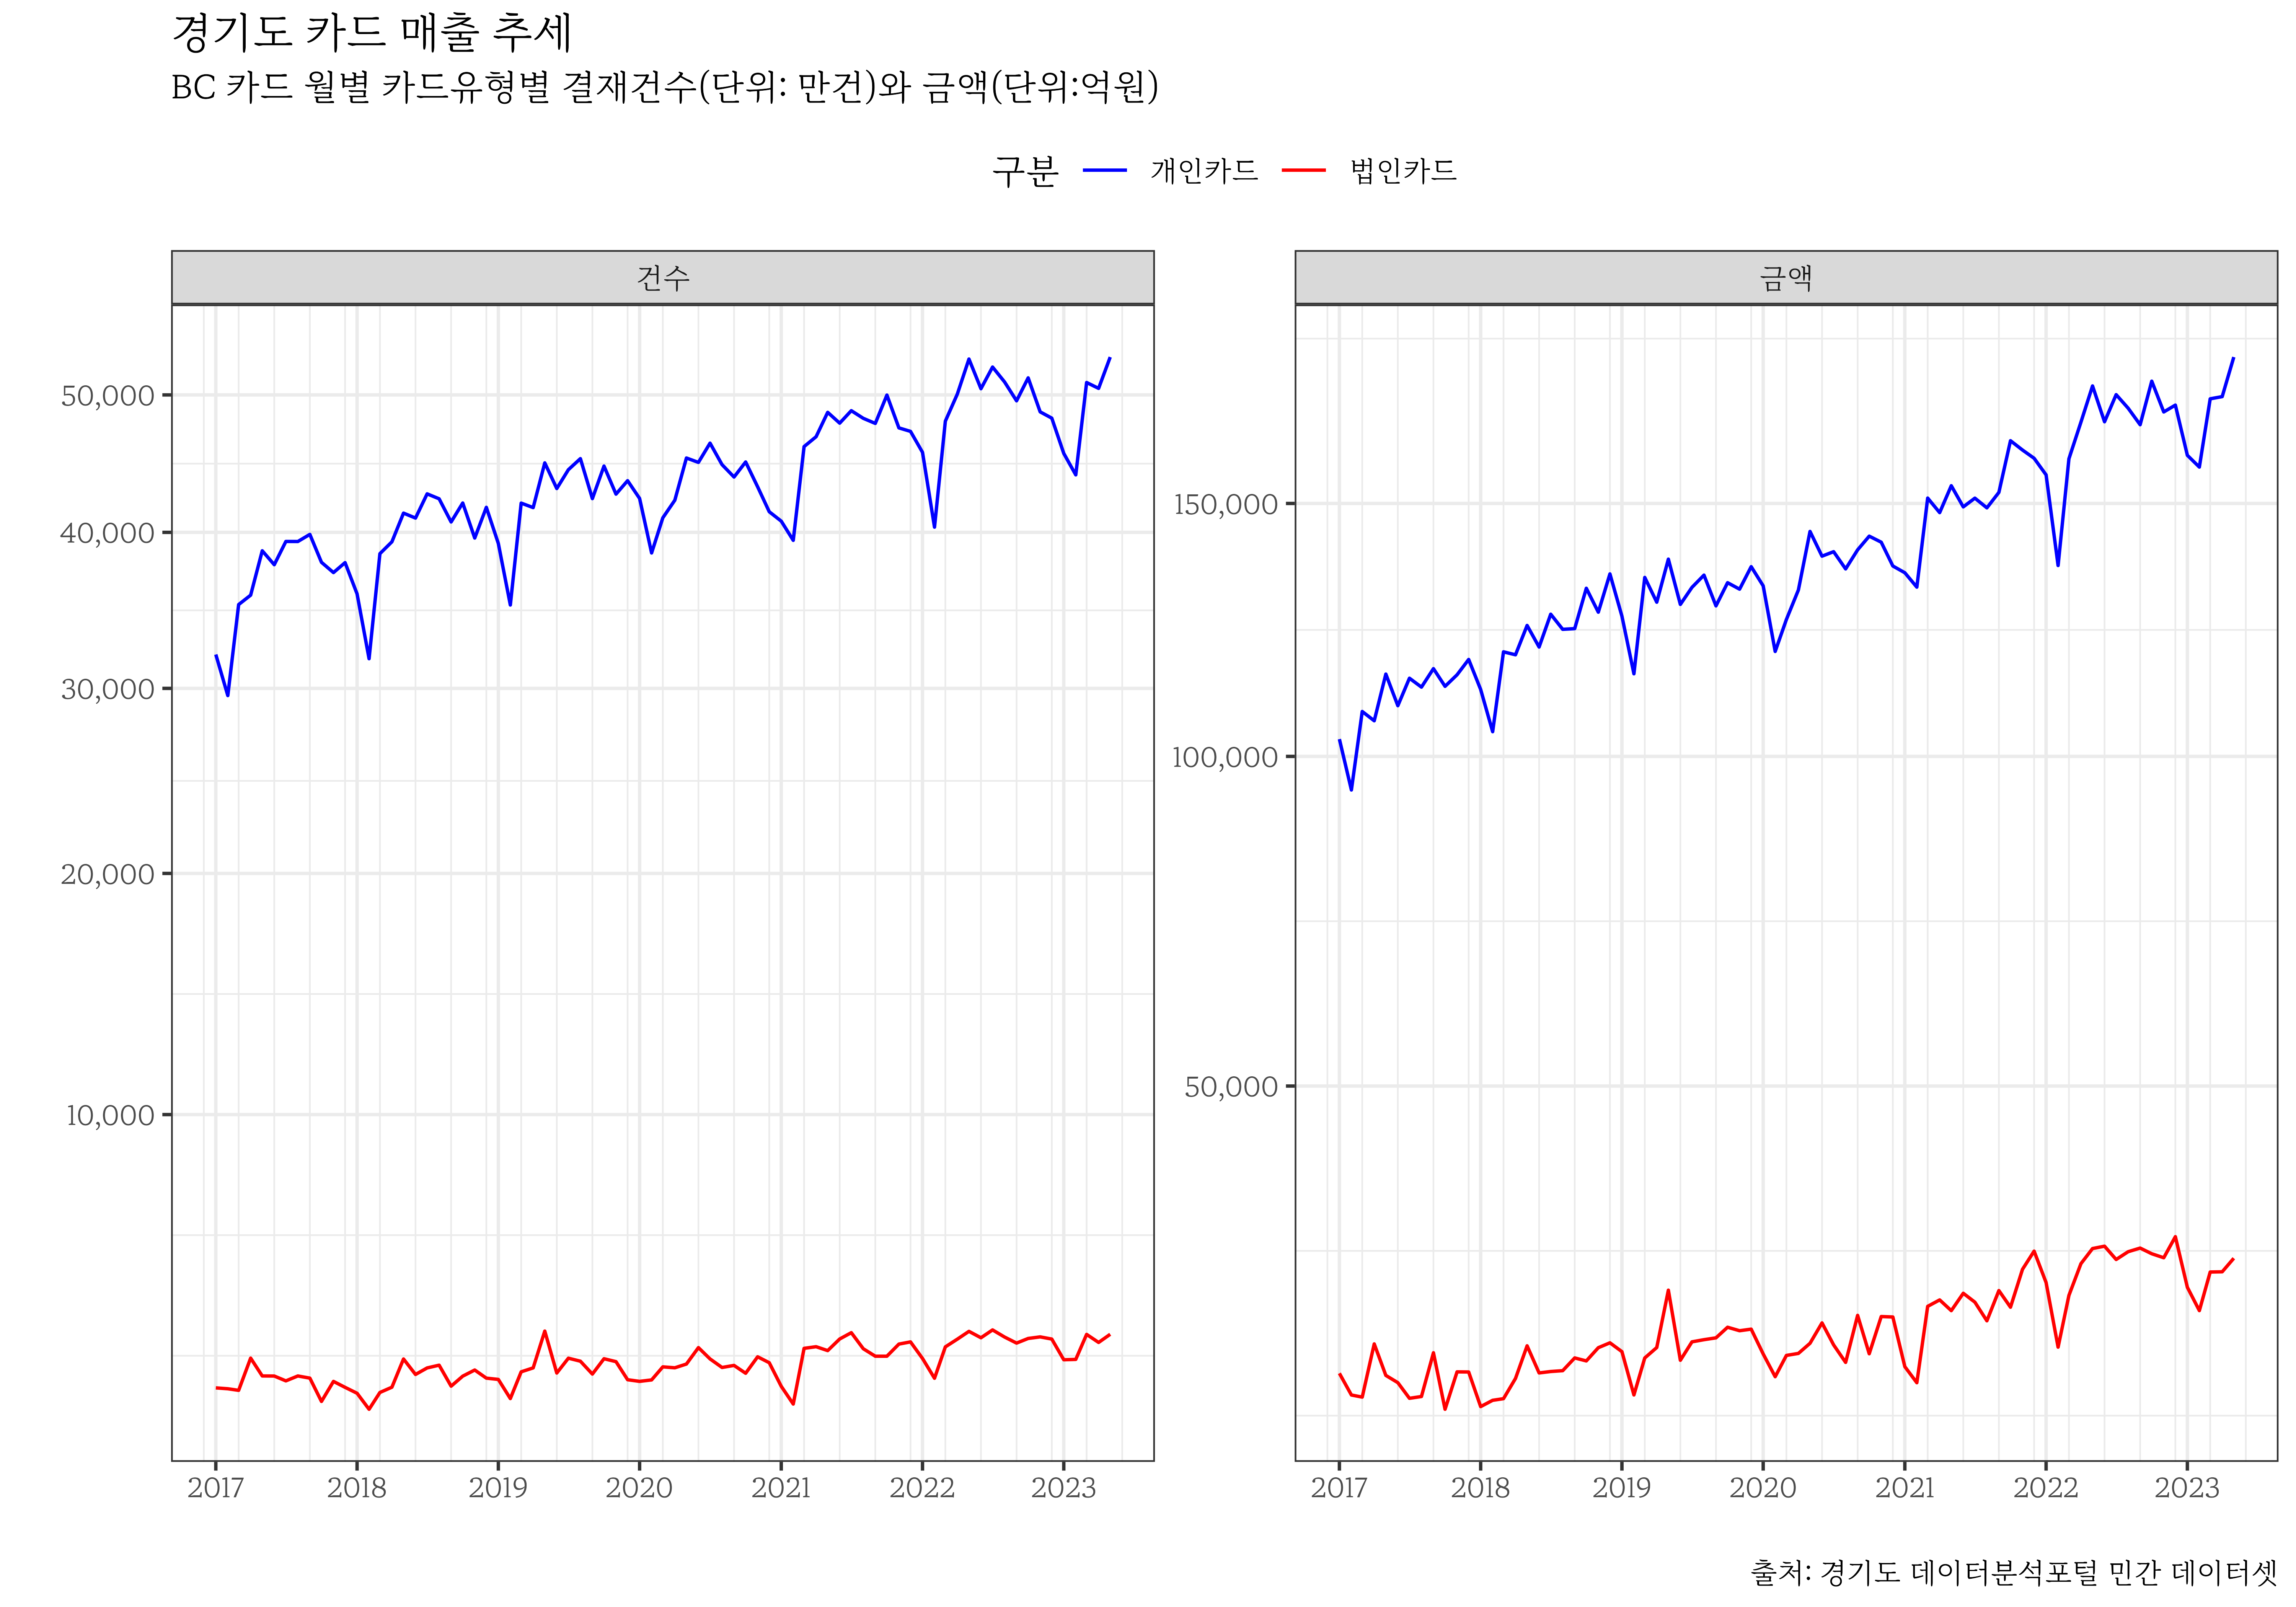
library(sf)

mst_tbl <- read_csv("data/(공통)셀블록도로행정동/경기도_시군구_행정동_명,CD.csv",
                    locale = locale('ko',encoding='euc-kr'))

gg_blk_sf <- st_read("data/(공통)셀블록도로행정동/블록경계/블록_v6_경기도/tbshp_block_v6_gg_20210412.shp")

gg_blk_tbl <- gg_blk_sf  %>%
  st_drop_geometry() %>%
  as_tibble()

gg_blk_mst_raw <- mst_tbl %>%
left_join(gg_blk_tbl)gg_blk_mst_tbl <- gg_blk_mst_raw %>% janitor::clean_names() %>%
select(cty_cd, cty_nm, admi_cd, admi_nm, blk_cd)
sgg_amt_tbl <- amt_tbl %>%
left_join(gg_blk_mst_tbl) %>%
group_by(ta_ym, cty_cd, cty_nm) %>%
summarise(결재금액 = sum(total_amt, na.rm=TRUE) / 10^8,
결재건수 = sum(total_cnt, na.rm=TRUE) / 10^4) %>%
ungroup()
sgg_amt_max_tbl <- sgg_amt_tbl %>%
filter(ta_ym == max(ta_ym)) %>%
pivot_longer(결재금액:결재건수)
library(ggrepel)
sgg_amt_tbl_gg <- sgg_amt_tbl %>%
pivot_longer(결재금액:결재건수) %>%
ggplot() +
geom_line(aes(x = ta_ym, y = value, color = cty_nm)) +
facet_wrap(~name, scales = "free_y") +
theme_bw(base_family = "MaruBuri") +
labs(x="", y= "",
title = "경기도 카드 매출 추세",
subtitle = "BC 카드 월별 시군구 결재건수(단위: 만건)와 금액(단위:억원)",
caption = "출처: 경기도 데이터분석포털 민간 데이터셋") +
scale_y_sqrt(labels = scales::comma) +
theme(legend.position = "none") +
scale_x_date(breaks = "1 year", minor_breaks = "3 months",
date_labels = "%Y") +
geom_point(data = sgg_amt_max_tbl, aes(x=ta_ym, y = value, color = cty_nm)) +
geom_text_repel(data = sgg_amt_max_tbl, aes(x=ta_ym, y = value, color = cty_nm, label= cty_nm), size = 3)
sgg_amt_tbl_gg
ragg::agg_png("images/BC/카드매출_월별_시군구_매출_건수_추세.png",
width = 10, height = 7, units = "in", res = 600)
sgg_amt_tbl_gg
dev.off()sea_sgg_mst <- gg_blk_mst_raw %>%
filter(str_detect(CTY_NM, "(^김포)|(^안산)|(^평택)|(^화성)|(^시흥)"))sea_sgg_mst_tbl <- sea_sgg_mst %>% janitor::clean_names() %>%
select(cty_cd, cty_nm, admi_cd, admi_nm, blk_cd)
sea_sgg_amt_tbl <- amt_tbl %>%
left_join(sea_sgg_mst_tbl) %>%
group_by(ta_ym, cty_cd, cty_nm) %>%
summarise(결재금액 = sum(total_amt, na.rm=TRUE) / 10^8,
결재건수 = sum(total_cnt, na.rm=TRUE) / 10^4) %>%
ungroup() %>%
drop_na()
sea_sgg_amt_max_tbl <- sea_sgg_amt_tbl %>%
filter(ta_ym == max(ta_ym)) %>%
pivot_longer(결재금액:결재건수)
sea_sgg_amt_tbl_gg <- sea_sgg_amt_tbl %>%
pivot_longer(결재금액:결재건수) %>%
ggplot() +
geom_line(aes(x = ta_ym, y = value, color = cty_nm)) +
facet_wrap(~name, scales = "free_y") +
theme_bw(base_family = "MaruBuri") +
labs(x="", y= "",
title = "경기도 카드 매출 추세",
subtitle = "BC 카드 월별 서해인접 시군구 결재건수(단위: 만건)와 금액(단위:억원)",
caption = "출처: 경기도 데이터분석포털 민간 데이터셋") +
scale_y_sqrt(labels = scales::comma) +
theme(legend.position = "none") +
scale_x_date(breaks = "1 year", minor_breaks = "3 months",
date_labels = "%Y") +
geom_point(data = sea_sgg_amt_max_tbl, aes(x=ta_ym, y = value, color = cty_nm)) +
geom_text_repel(data = sea_sgg_amt_max_tbl, aes(x=ta_ym, y = value, color = cty_nm, label= cty_nm), size = 3)
sea_sgg_amt_tbl_gg
ragg::agg_png("images/BC/카드매출_월별_서해인접_시군구_매출_건수_추세.png",
width = 10, height = 7, units = "in", res = 600)
sea_sgg_amt_tbl_gg
dev.off()
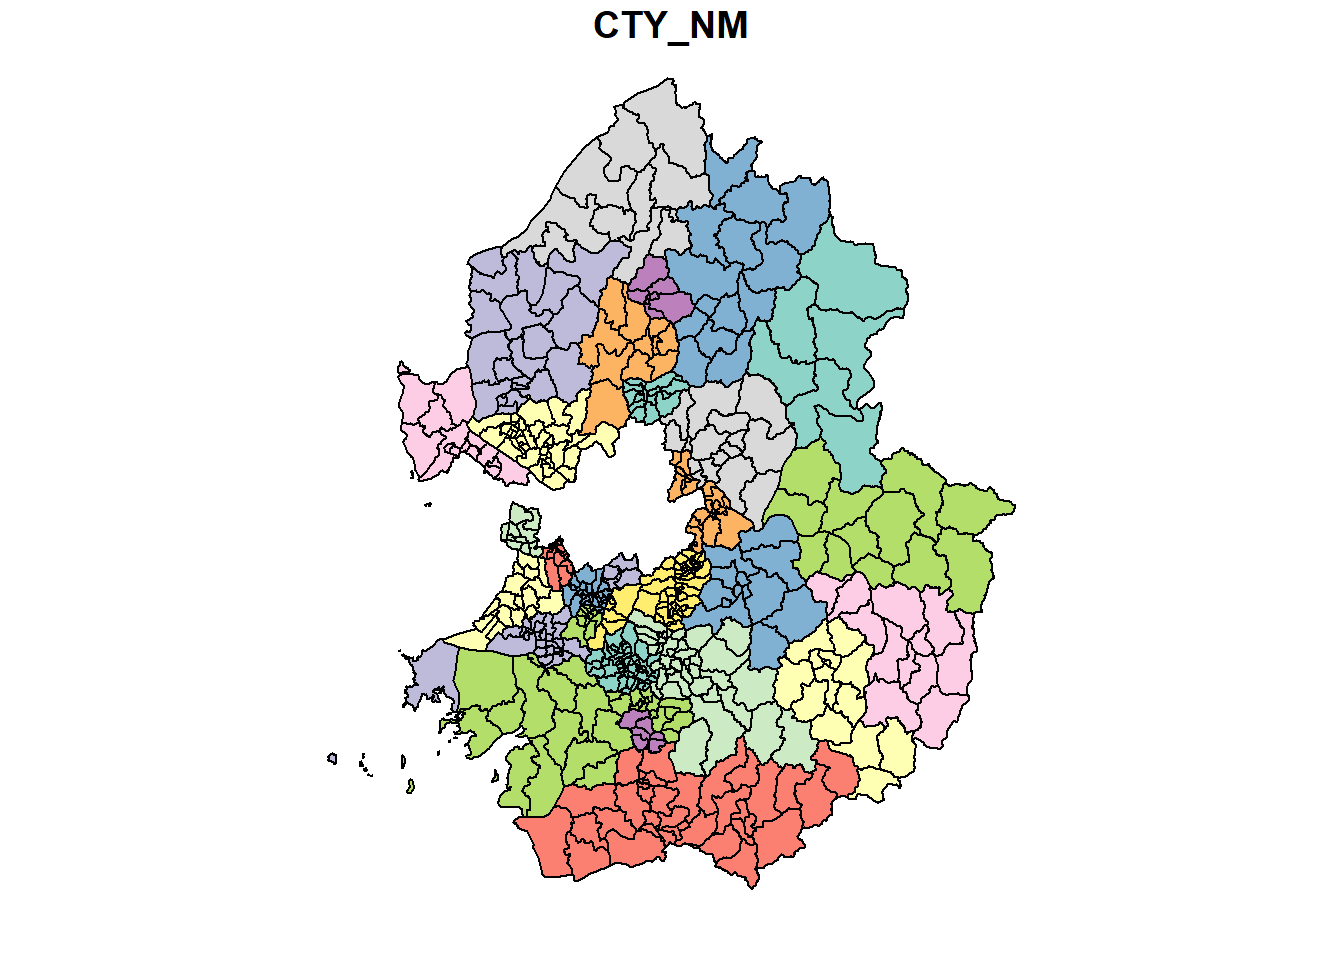
gg_blk_sf <- st_read("data/(공통)셀블록도로행정동/블록경계/블록_v6_경기도/tbshp_block_v6_gg_20210412.shp")

mst_tbl <- read_csv("data/(공통)셀블록도로행정동/경기도_시군구_행정동_명,CD.csv",
                    locale = locale('ko',encoding='euc-kr'))

sea_blk_sf <- gg_blk_sf %>%
  left_join(mst_tbl) %>%
  filter(str_detect(CTY_NM, "(^김포)|(^안산)|(^평택)|(^화성)|(^시흥)"))

sea_blk_sf %>%
  ggplot() +
    geom_sf() +
theme_void()김포_sf <- st_read("data/sgg_map/김포시.geojson")
amt_start_tbl <- amt_tbl %>%
filter(ta_ym == min(ta_ym))
amt_end_tbl <- amt_tbl %>%
filter(ta_ym == max(ta_ym))
sea_blk_amt_sf <- sea_blk_sf %>%
janitor::clean_names() %>%
left_join(amt_start_tbl) %>%
mutate(total_manwon_amt = total_amt / 10^8)
sea_blk_amt_sf <- st_set_crs(sea_blk_amt_sf, sf::st_crs(김포_sf))
sea_blk_amt_sf_gg <- sea_blk_amt_sf %>%
ggplot() +
geom_sf(aes(fill = total_manwon_amt)) +
geom_sf(data = sea_blk_amt_sf, color = "red", fill = "transparent") +
scale_fill_viridis_c(option = "D", direction = 1) +
theme_void() +
labs(fill = "결재금액(억원)")
sea_blk_amt_sf_gg
ragg::agg_png("images/BC/카드매출_월별_서해인접_시군구_매출_201701.png",
width = 10, height = 7, units = "in", res = 600)
sea_blk_amt_sf_gg
dev.off()
sea_blk_end_amt_sf <- sea_blk_sf %>%
  janitor::clean_names() %>%
  left_join(amt_end_tbl) %>%
  mutate(total_manwon_amt = total_amt / 10^8)

sea_blk_end_amt_sf <- st_set_crs(sea_blk_end_amt_sf, sf::st_crs(김포_sf))

sea_blk_end_amt_gg <- sea_blk_end_amt_sf %>%
  ggplot() +
    geom_sf(aes(fill = total_manwon_amt)) +
    scale_fill_viridis_c(option = "D", direction = 1) +
    theme_void() +
    labs(fill = "결재금액(억원)")

sea_blk_end_amt_gg

ragg::agg_png("images/BC/카드매출_월별_서해인접_시군구_매출_202305.png",
              width = 10, height = 7, units = "in", res = 600)
sea_blk_end_amt_gg
dev.off()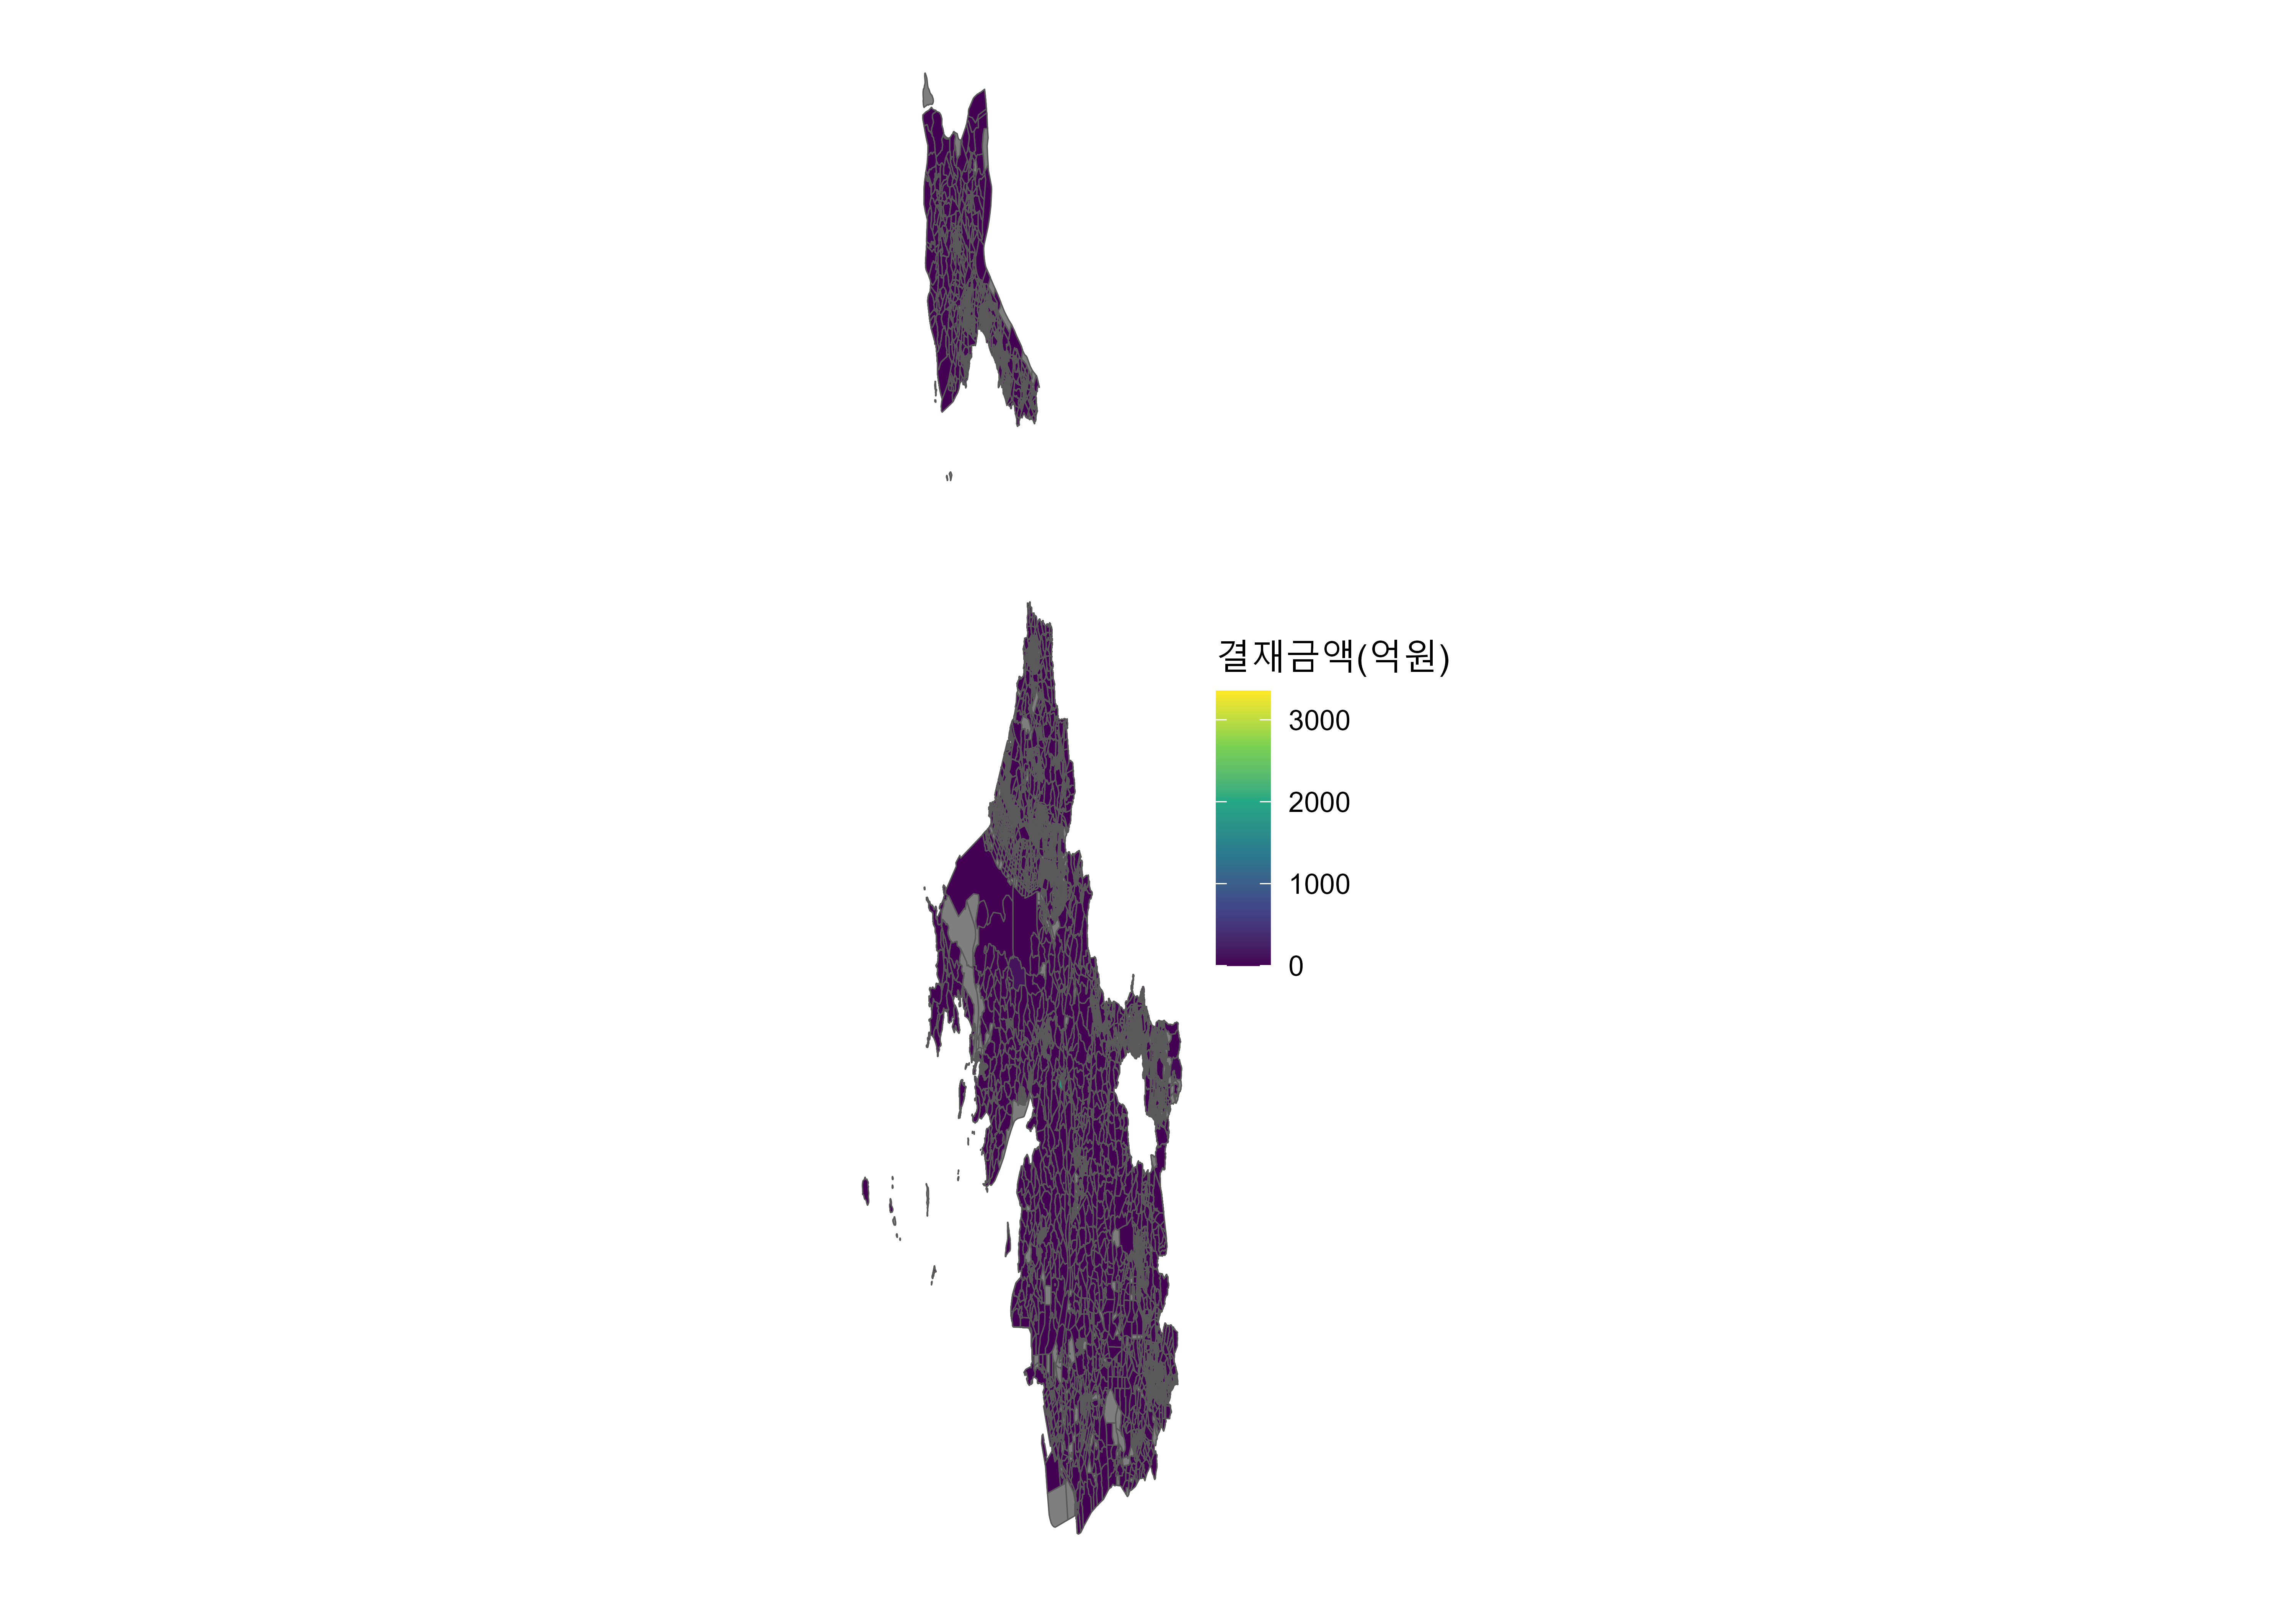
sgg_names <- sea_blk_end_amt_sf %>%
  st_drop_geometry() %>%
  count(cty_nm) %>%
  pull(cty_nm)

sgg_maps <- map(.x = sgg_names,
            .f = function(x) sea_blk_end_amt_sf %>%
              filter(cty_nm == x) %>%
              ggplot() +
                geom_sf(aes(fill = total_manwon_amt)) +
                scale_fill_viridis_c(option = "D", direction = 1) +
                theme_void() +
                labs(fill = "결재금액(억원)"))

## use COWplot to combine and add single legend
library(cowplot)

sgg_individual_plot <- plot_grid(plotlist = sgg_maps, labels = sgg_names, label_size = 10, nrow = 2)

sgg_individual_plot

ragg::agg_png("images/BC/카드매출_월별_서해인접_시군구_개별_매출_202305.png",
              width = 10, height = 7, units = "in", res = 600)
sgg_individual_plot
dev.off()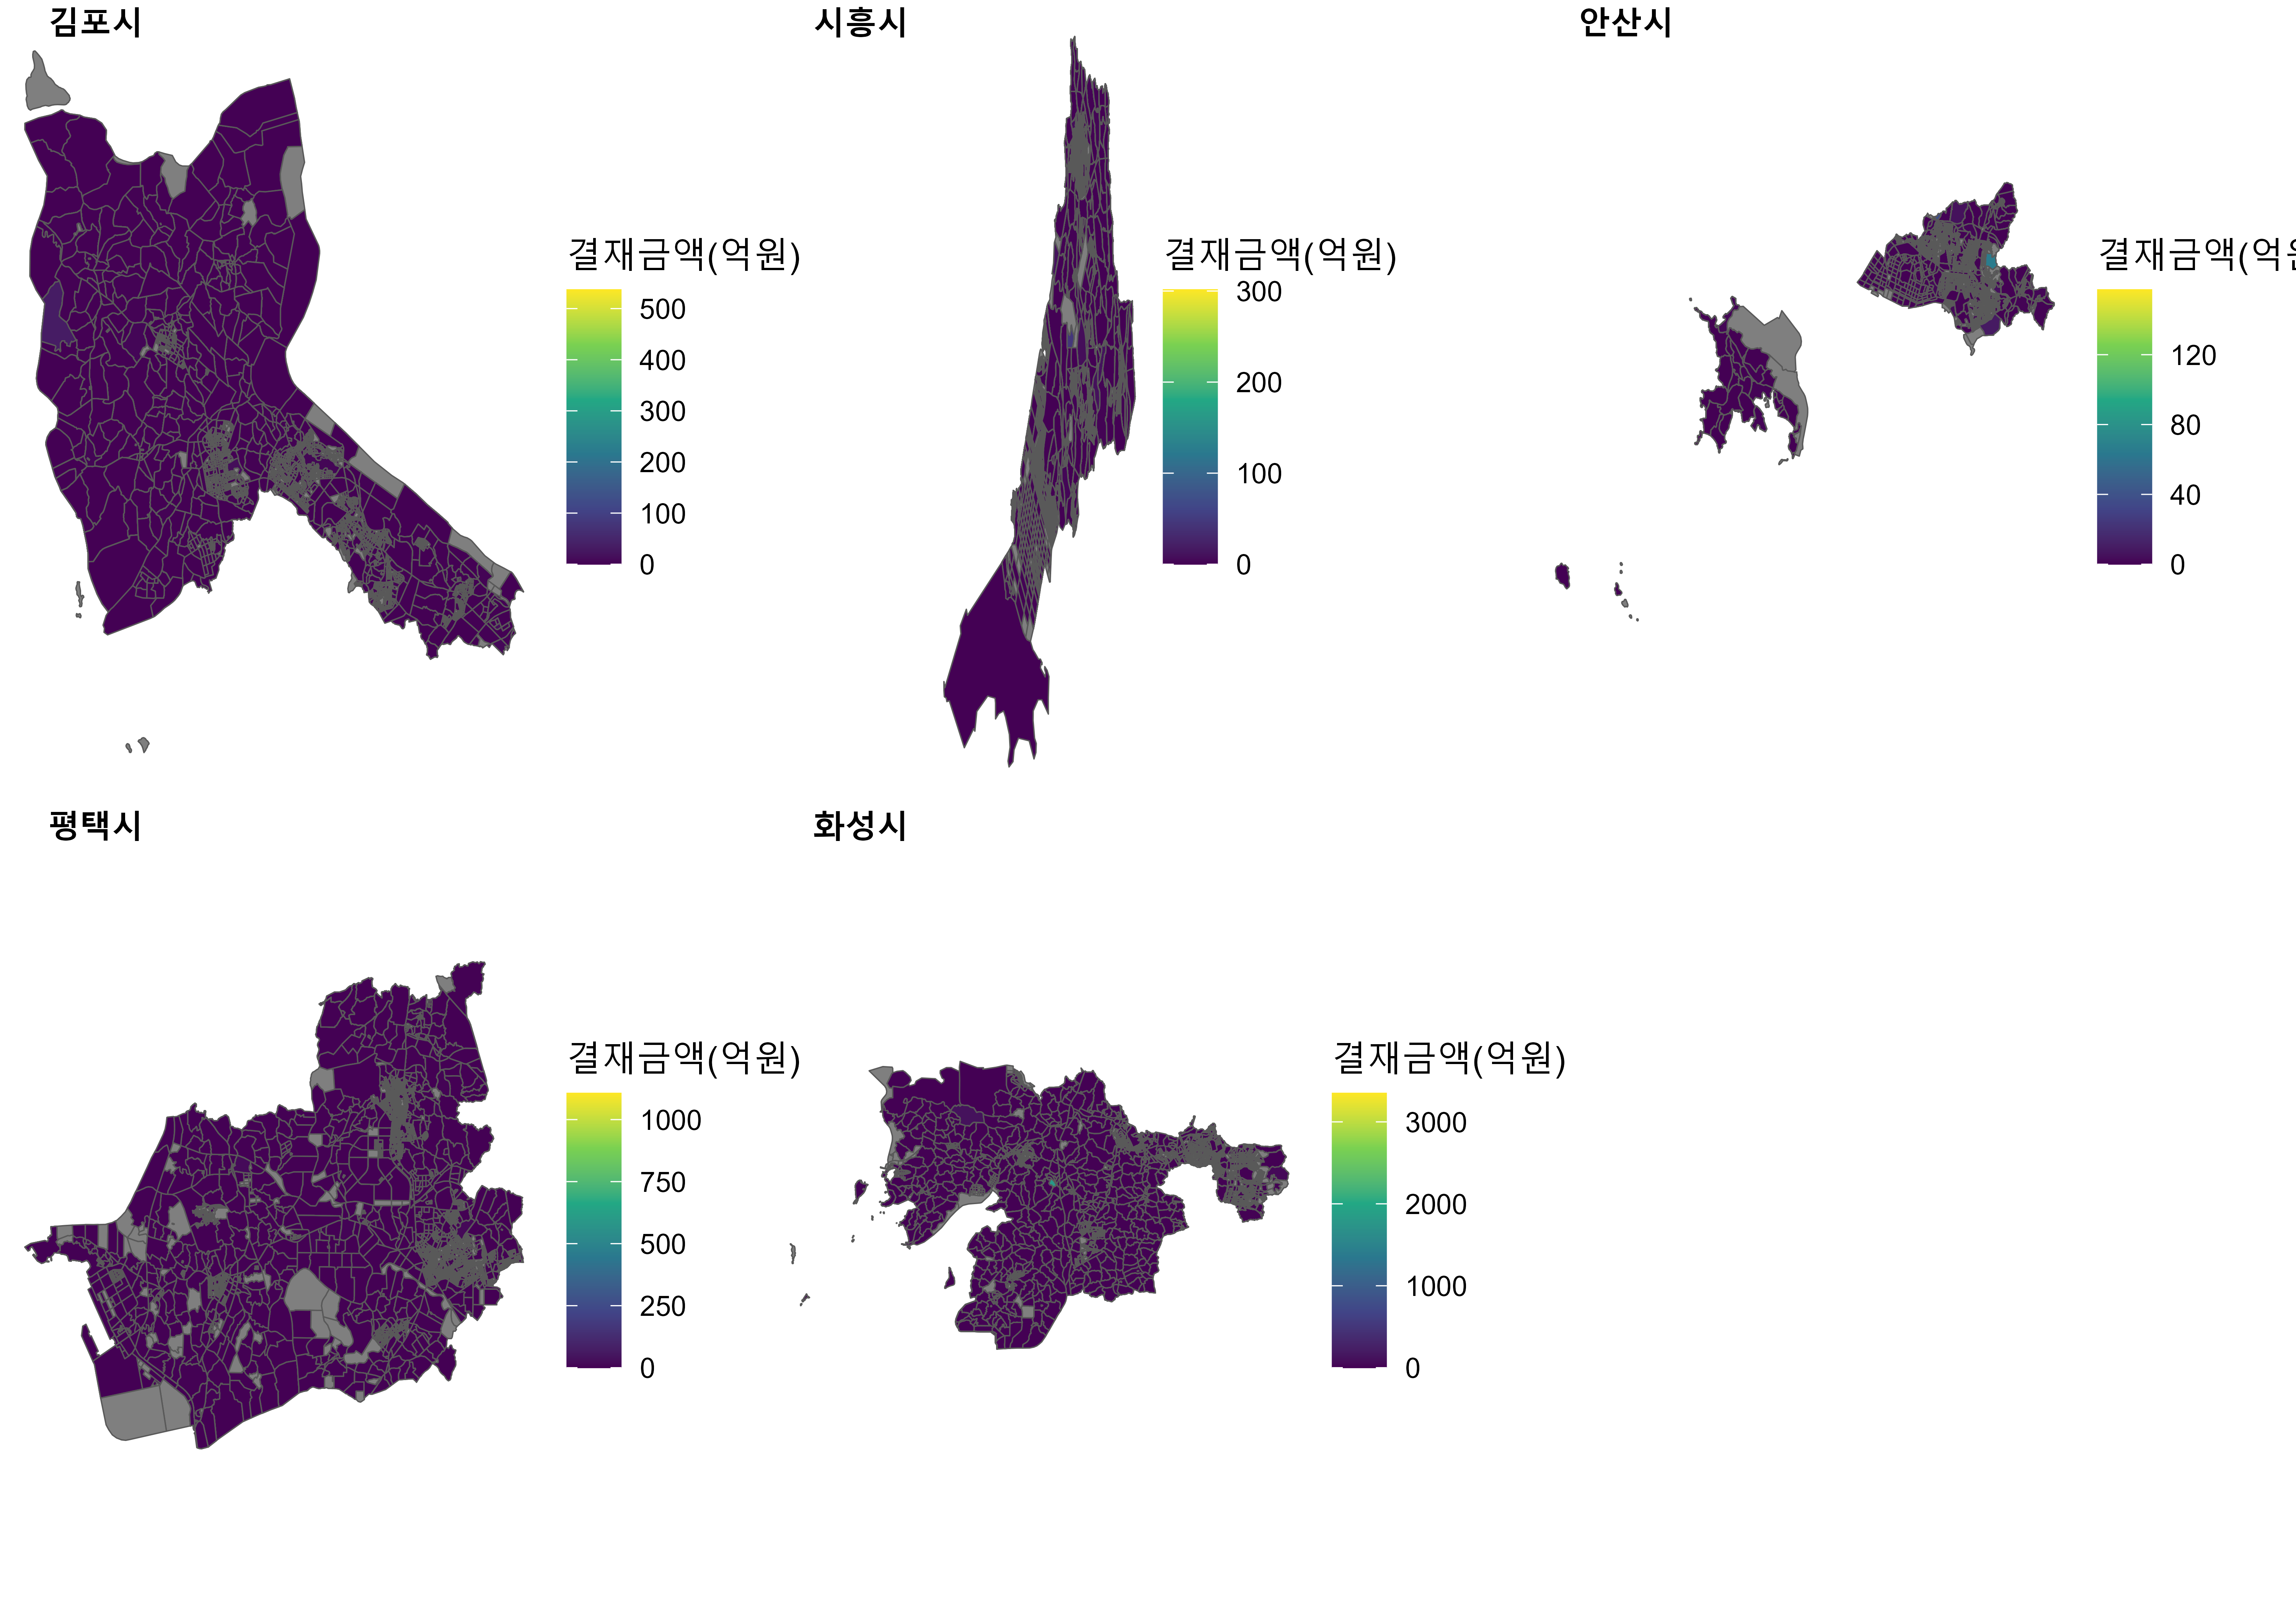
자료구조는 다음과 같다.
광명시 CTY_CD == 4121
# cell_sf <- sf::read_sf("(공통)셀블록도로행정동/셀(격자)/cell_gg_square_admi2_20210614.shp")

# fs::dir_create("km_sf")
#
# cell_sf %>%
#   filter(CTY_CD == "4121") %>%
#   sf::write_sf("km_sf/kwangmyung.shp")

kwangmyung_cell_sf <- sf::read_sf("km_sf/kwangmyung.shp")

kwangmyung_cell_sf %>%
  filter(CTY_CD == "4121") %>%
  select(CTY_CD, geometry) %>%
  plot()
자료구조는 다음과 같다.
kwangmyung_cell_sf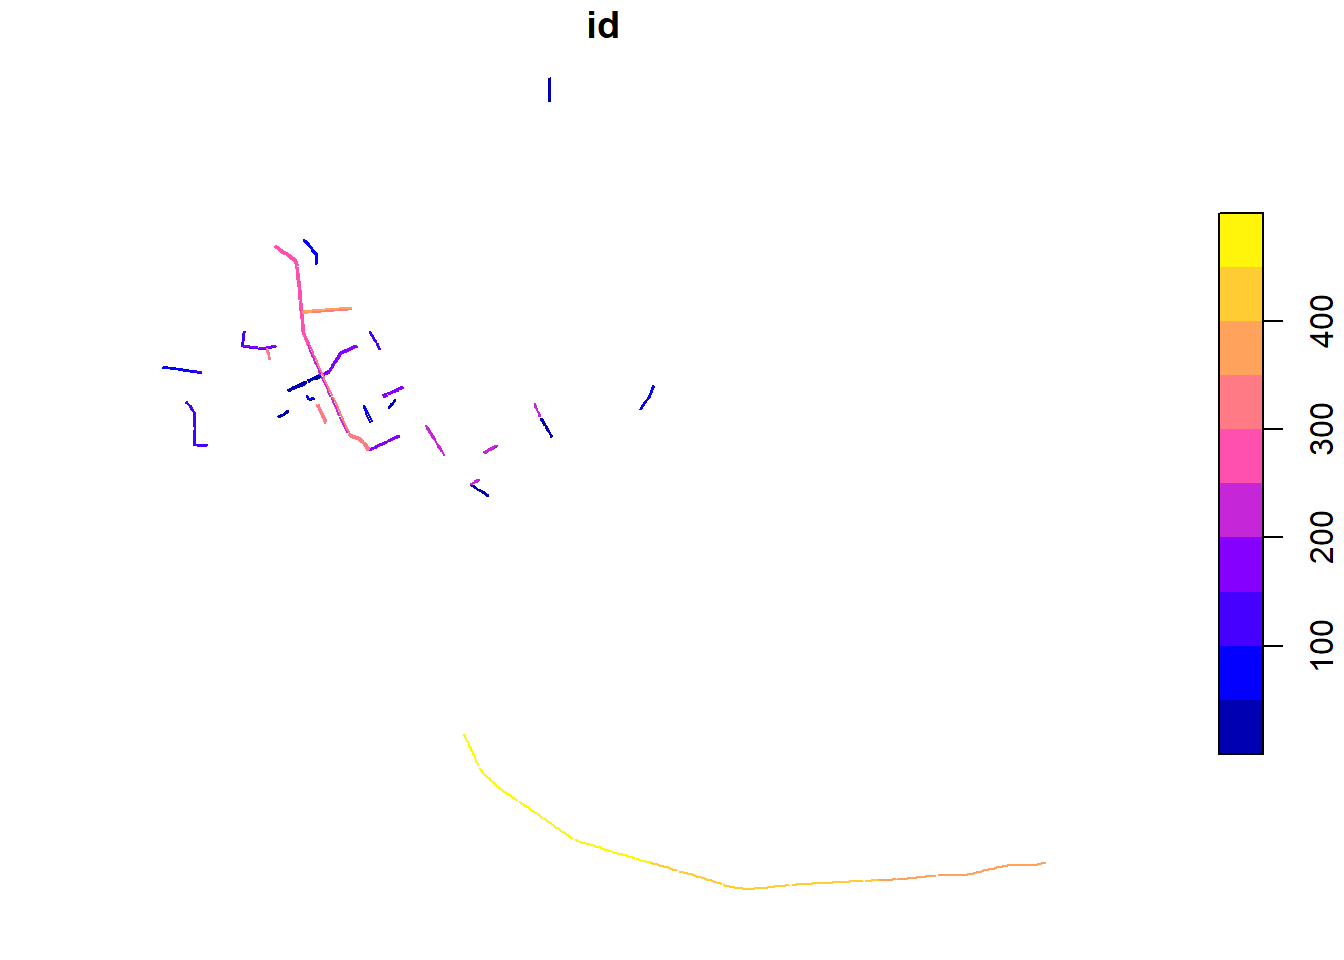
자료구조는 다음과 같다.
road_sf광명시 CTY_CD == 4121
cell_block_raw <- read_delim("(공통)셀블록도로행정동/셀_블록_행정동/kt_cell_v6_20210528.csv")

cell_block_mask <- cell_block_raw %>%
  complete.cases()

cell_block_raw <- cell_block_raw %>%
  filter(cell_block_mask)

cell_block_sf <- st_as_sf(x = cell_block_raw,
                          coords = c("X_AXIS", "Y_AXIS"),
                          crs = "+proj=tmerc +lat_0=38 +lon_0=128 +k=0.9999 +x_0=400000 +y_0=600000 +ellps=bessel +towgs84=-115.8,474.99,674.11,1.16,-2.31,-1.63,6.43 +units=m +no_defs")

kwangmyung_block_cell_sf <- cell_block_sf %>%
  mutate(CTY_CD = str_sub(ADMI_CD, 1, 4)) %>%
  filter(CTY_CD == "4121")

kwangmyung_block_cell_sf %>%
  sf::write_sf("km_sf/kwangmyung_cell_block.shp")
시군구 행정동명에서 셀코드를 추출하는 방법을 기술한다.
cell_cd_raw <- read_csv("data/(공통)셀블록도로행정동/셀(격자)/cell_gg_square_admi2_20210614.csv")

get_city_cd <- function(city_name = "광명") {
  sgg_cd_tbl %>%
    filter(str_detect(CTY_NM, city_name)) %>%
    pull(CTY_CD) %>%
    unique()
}

kwangmyung_cell <- cell_cd_raw %>%
  filter(CTY_CD == get_city_cd("광명")) %>%
  pull(cell_id) %>%
  unique(.)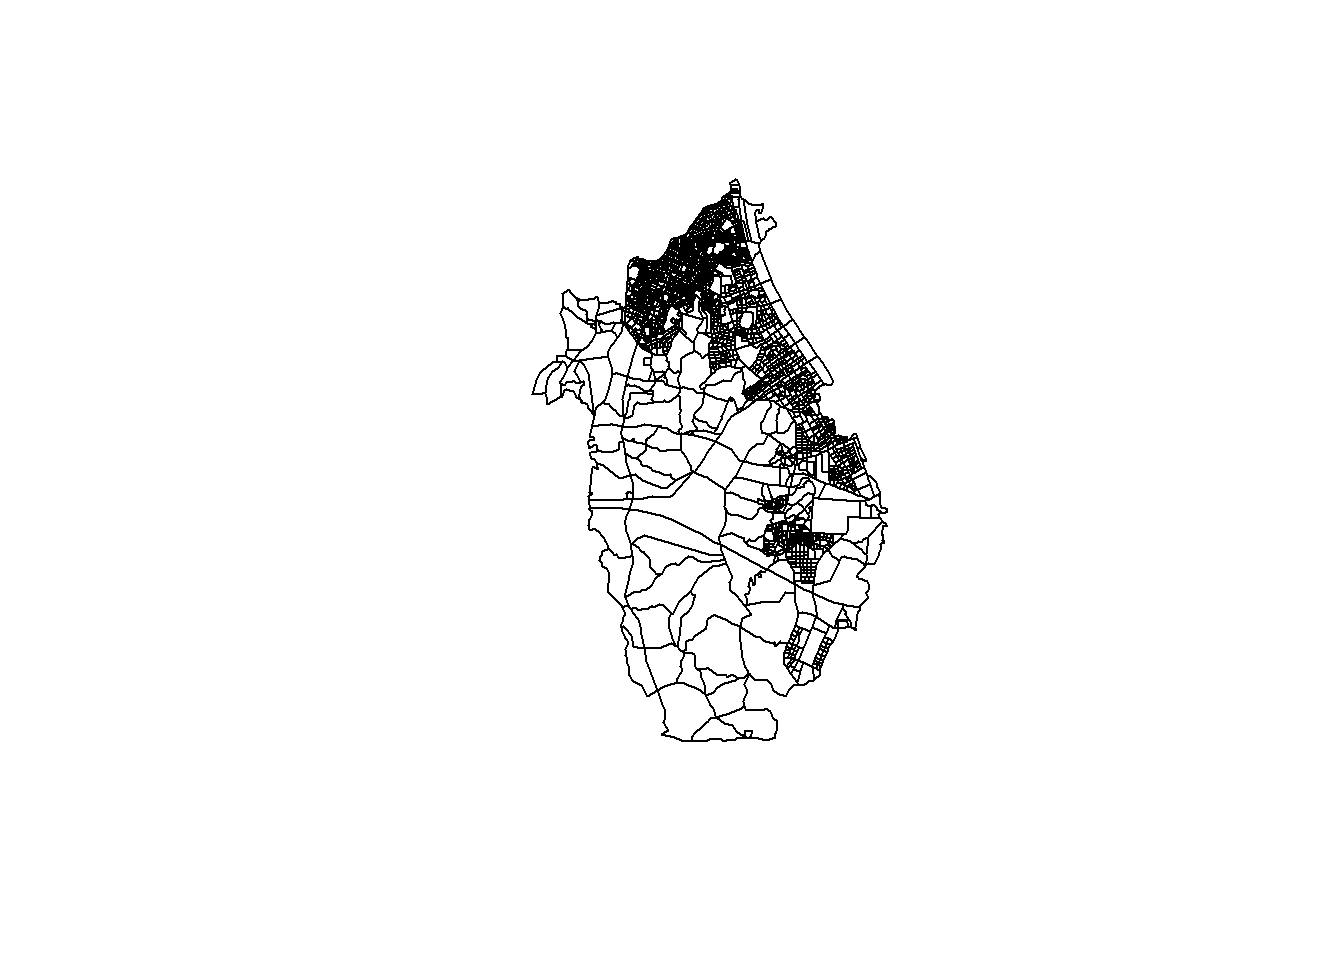
library(sf)
library(rgdal)

gg_raw <- sf::st_read("data/(공통)셀블록도로행정동/셀(중심점)/cell_gg_admi2_20210616.shp")

## 좌표계 변환 KATEC --> WGS84
km_sf <- gg_raw %>%
  filter(CTY_CD == get_city_cd("광명")) %>%
  st_transform(crs = "+proj=longlat +ellps=bessel +no_defs +towgs84=-115.80,474.99,674.11,1.16,-2.31,-1.63,6.43")

km_sf %>%
  st_write("data/km_cell.geojson")
library(sf)

km_sf <- st_read("data/km_cell.geojson")

plot(st_geometry(km_sf))국가공간정보포털 (센서스경계)행정동경계 파일을 다운로드 받아 이를 점검해보자.
*Bessel 1841 경위도: 한국과 일본에 잘 맞는 지역타원체를 사용한 좌표계 EPSG:4004, EPSG:4162 (Korean 1985) +proj=longlat +ellps=bessel +no_defs +towgs84=-115.80,474.99,674.11,1.16,-2.31,-1.63,6.43

library(sf)

km_dong_sf <- gg_dong_sf %>%
  filter(str_sub(ADMI_CD, 1, 4) == get_city_cd("광명")) %>%
  mutate(행정동 = str_sub(ADMI_CD, 1, 7)) %>%
  group_by(행정동) %>%
  summarize(geometry = st_union(geometry)) %>%
  st_transform(crs = "+proj=longlat +ellps=bessel +no_defs +towgs84=-115.80,474.99,674.11,1.16,-2.31,-1.63,6.43")

plot(st_geometry(km_dong_sf))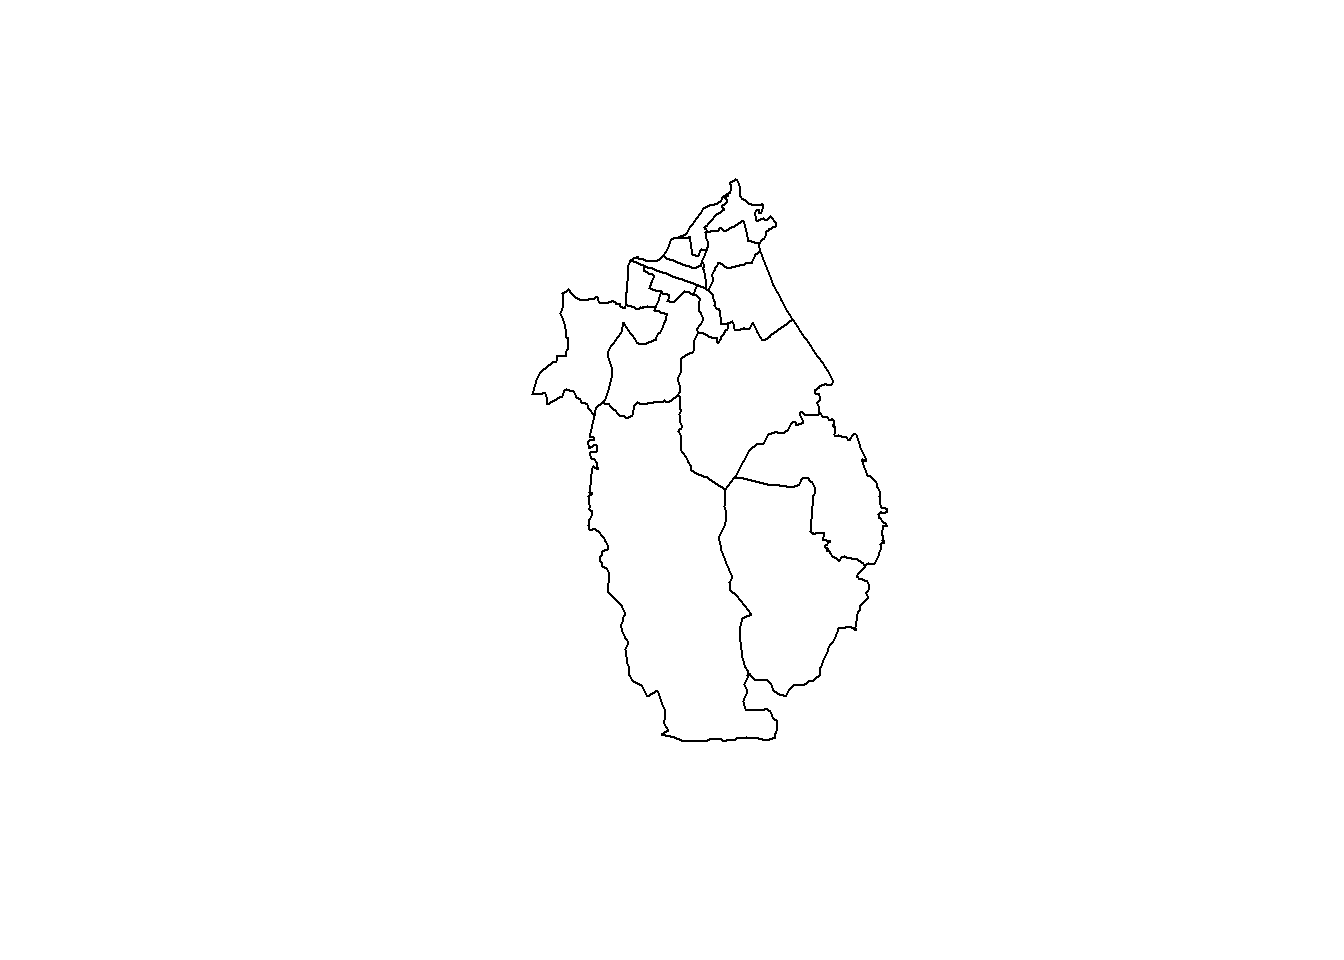
extrafont::loadfonts()

kt_cell_files <- fs::dir_ls("data/KT유동인구데이터/셀단위/sex_age/")

sex_age_raw <- read_csv("data/KT유동인구데이터/셀단위/sex_age/sex_age_201706.csv")

km_sex_age <- sex_age_raw %>%
    ## 광명시만 추출
  filter(cell_id %in% unique(km_cell_sf$cell_id)) %>%
  ## 자료구조 변환
  pivot_longer(cols = M00_09:F60_up, names_to = "name", values_to = "인구수") %>%
  mutate(성별 = str_sub(name, 1,1),
         연령대 = str_sub(name, 2, 6)) %>%
  ## 자료형 변환
  mutate(연령대 = factor(연령대, levels = c("00_09", "10_19", "20_29", "30_39", "40_49", "50_59", "60_up")),
         성별 = factor(성별, levels = c("M", "F"), labels = c("남성", "여성"))) %>%
  select(-name)

km_grid_tbl <- st_drop_geometry(grid_map) %>%
  as_tibble()

km_tbl <- st_drop_geometry(km_map) %>%
  as_tibble()

km_dong_tbl <- left_join(km_grid_tbl, km_tbl, by = c("MEGA_CD", "ADMI_CD"))

km_sex_age_tbl <- km_sex_age %>%
  left_join(km_dong_tbl)

km_sex_age_tbl %>%
  group_by(etl_ym, ADMI_NM) %>%
  summarise(인구수 = sum(인구수))
## MEGA_CD, ADMI_CD, cell_id 결합
km_grid_tbl <- st_drop_geometry(grid_map) %>%
  as_tibble()

km_tbl <- st_drop_geometry(km_map) %>%
  as_tibble()

km_dong_tbl <- left_join(km_grid_tbl, km_tbl, by = c("MEGA_CD", "ADMI_CD"))

## 광명시
get_km_sex_age <- function(yearmon="data/KT유동인구데이터/셀단위/sex_age/sex_age_201706.csv") {

  cat("\n ------------------\n", yearmon, "\n")

  sex_age_raw <- read_csv(yearmon)

  km_sex_age <- sex_age_raw %>%
      ## 광명시만 추출
    filter(cell_id %in% unique(km_cell_sf$cell_id)) %>%
    ## 자료구조 변환
    pivot_longer(cols = M00_09:F60_up, names_to = "name", values_to = "인구수") %>%
    mutate(성별 = str_sub(name, 1,1),
           연령대 = str_sub(name, 2, 6)) %>%
    ## 자료형 변환
    mutate(연령대 = factor(연령대, levels = c("00_09", "10_19", "20_29", "30_39", "40_49", "50_59", "60_up")),
           성별 = factor(성별, levels = c("M", "F"), labels = c("남성", "여성"))) %>%
    select(-name)

  km_sex_age_tbl <- km_sex_age %>%
    left_join(km_dong_tbl)

  return(km_sex_age_tbl)
}

get_km_sex_age()kt_cell_files_raw <- fs::dir_ls("data/KT유동인구데이터/셀단위/sex_age/")
kt_cell_files <- kt_cell_files_raw %>%
enframe() %>%
## 2018~2022년만 추출
mutate(년월 = str_sub(str_extract(name, "\\d+"), 1, 4)) %>%
filter(!년월 %in% c("2017")) %>%
## 2018~2022년만 추출
mutate(년월 = str_sub(str_extract(name, "\\d+"), 1, 6)) %>%
mutate(년월 = lubridate::ym(년월))
km_age_sex_yearmon <- kt_cell_files %>%
mutate(data = map(name, get_km_sex_age))
km_age_sex_yearmon %>%
write_rds("data/km_age_sex_yearmon.rds")extrafont::loadfonts()
km_age_sex_yearmon <-
read_rds("data/km_age_sex_yearmon.rds")
km_age_sex_yearmon_tbl <- km_age_sex_yearmon %>%
unnest(data) %>%
mutate(년월 = lubridate::ym(etl_ym))
km_year_mon_total <- km_age_sex_yearmon_tbl %>%
group_by(년월) %>%
summarise(인구수 = sum(인구수))
km_year_mon_total_gg <- km_year_mon_total %>%
mutate(인구수 = 인구수 / 10^4) %>%
ggplot(aes(x=년월, y=인구수)) +
geom_point() +
geom_line() +
theme_bw(base_family = "Malgun Gothic") +
labs(title = "광명시 월별 유동인구",
subtitle = "2018년 1월 ~ 2022년 12월",
x = "",
y = "유동인구(만명)",
caption = "데이터 출처: KT 유동인구 데이터(경기도 데이터분석센터") +
scale_y_continuous(labels = scales::comma)
km_year_mon_total_gg
fs::dir_create("images/KT")
ragg::agg_png("images/KT/광명시_월별_유동인구.png",
width = 10, height = 7, units = "in", res = 600)
km_year_mon_total_gg
dev.off()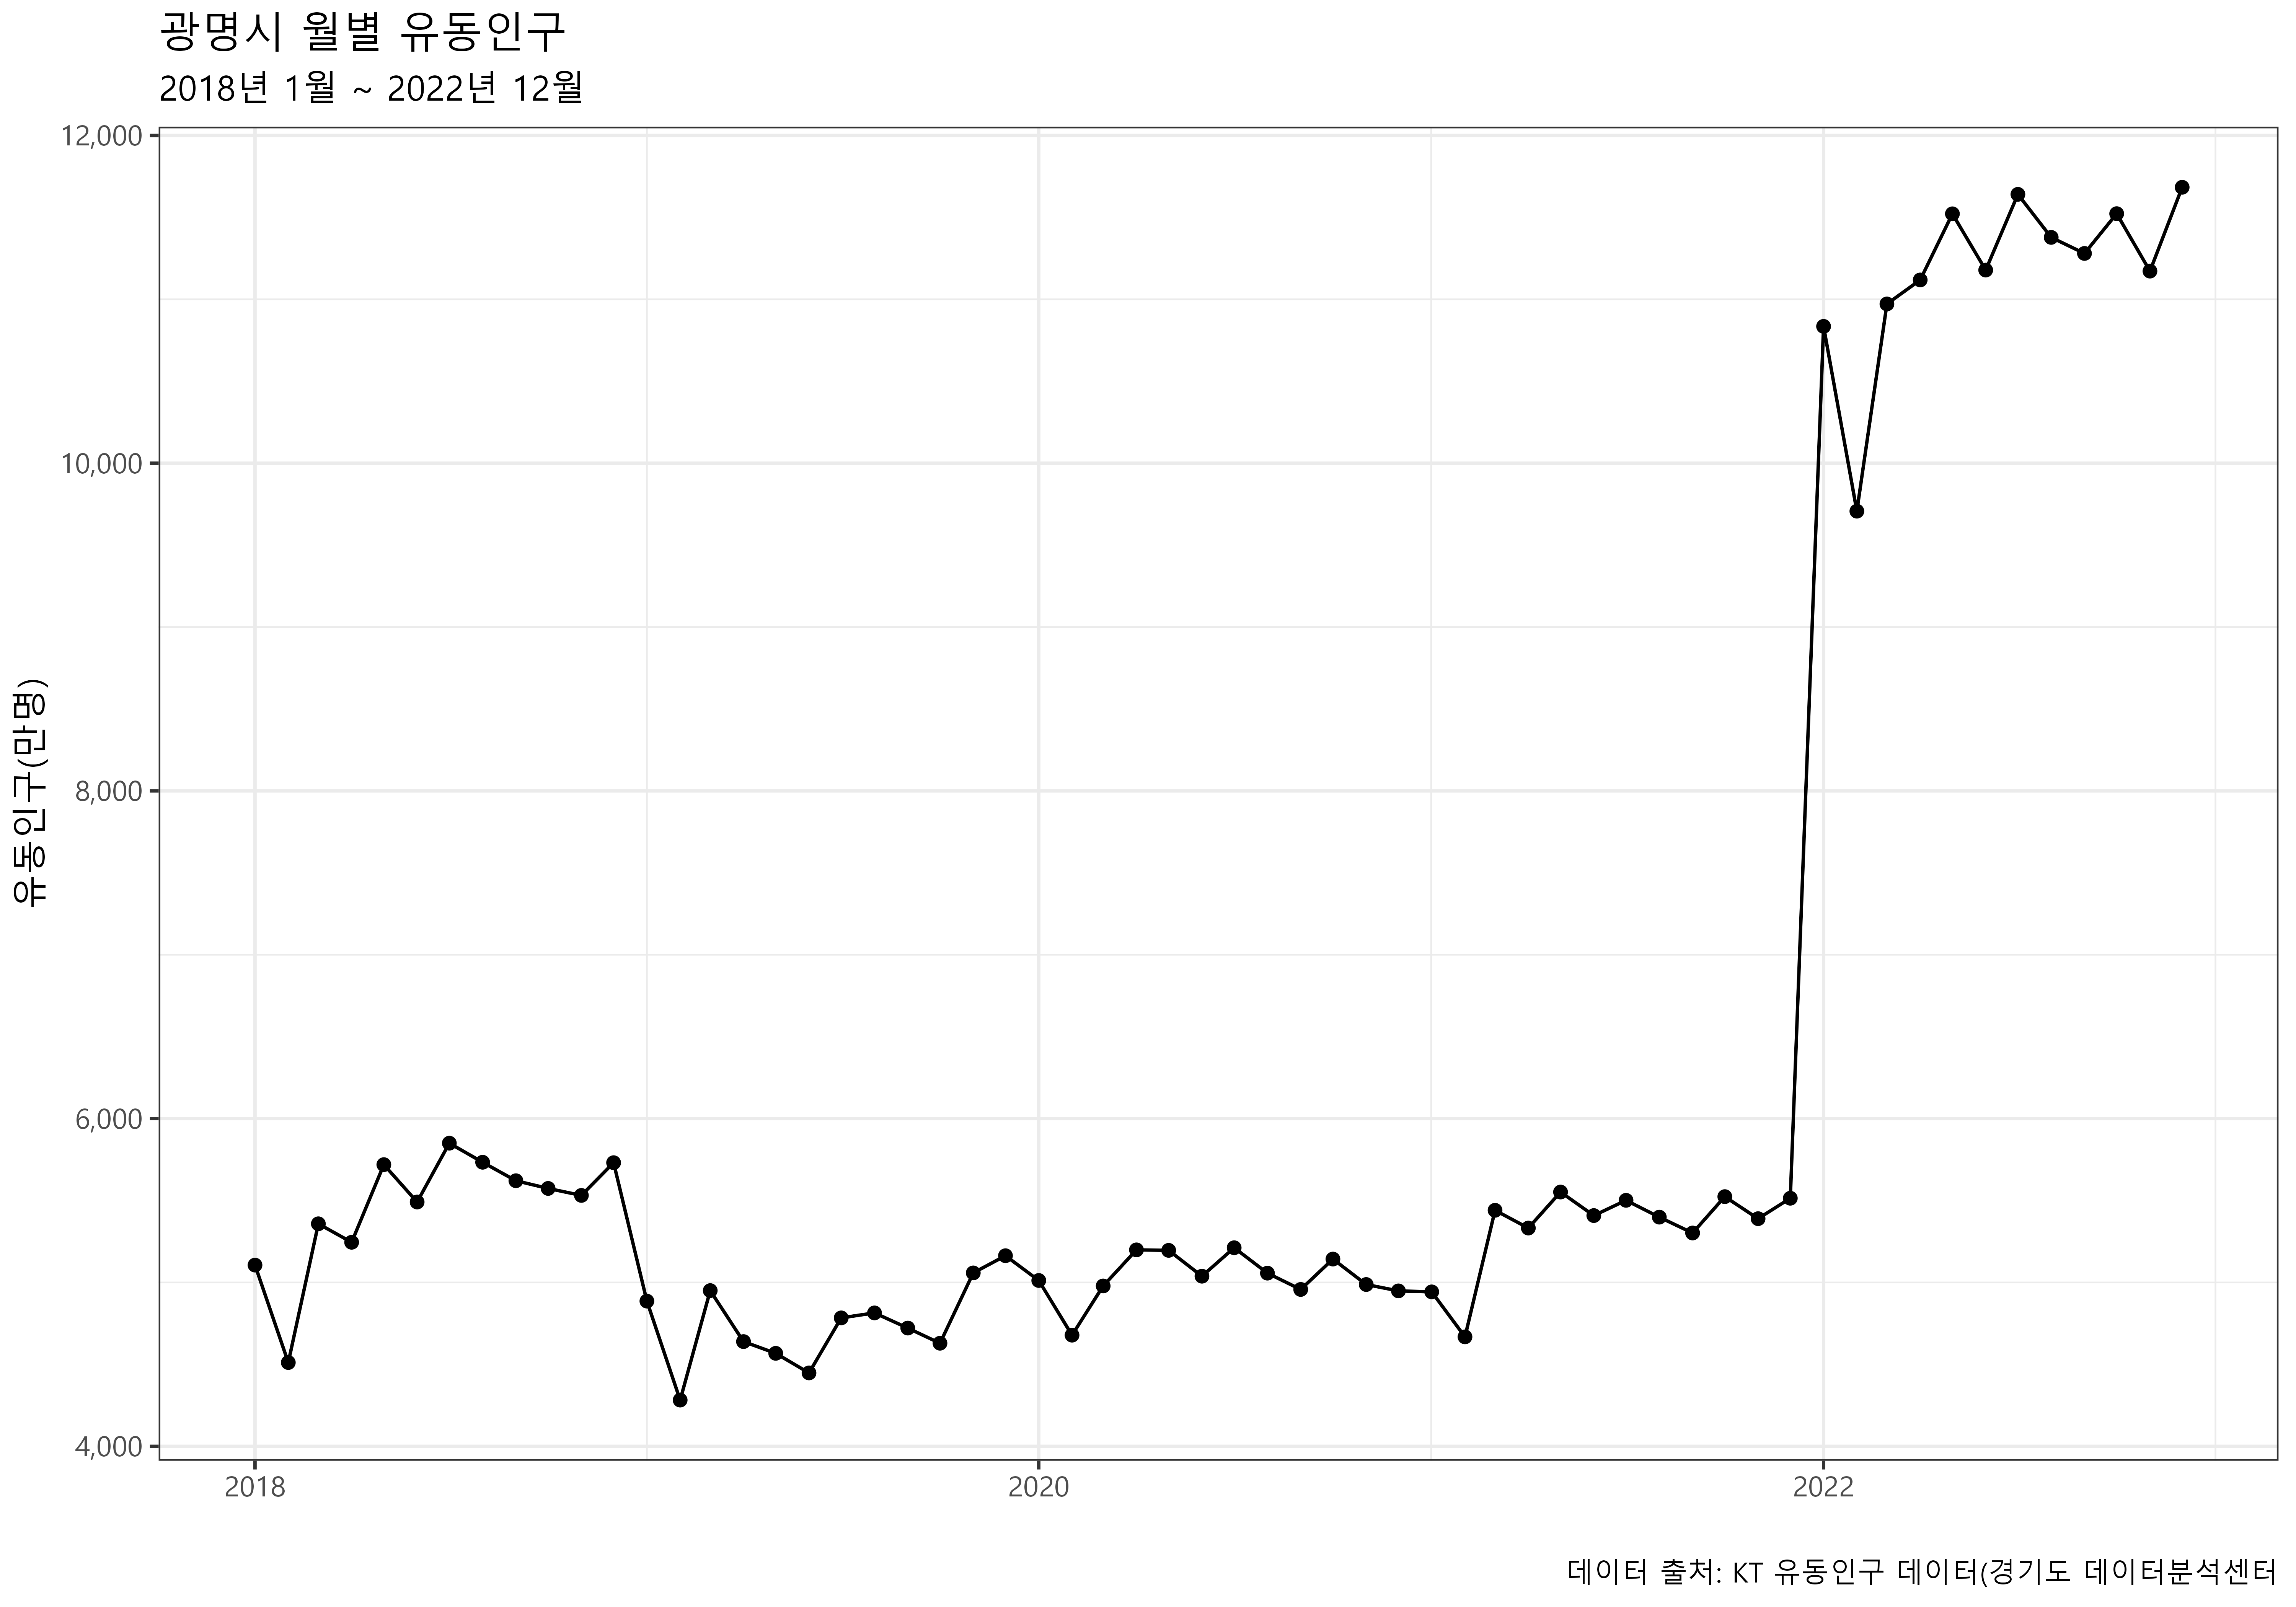
km_year_mon_total_dong <- km_age_sex_yearmon_tbl %>%
  group_by(년월, ADMI_NM) %>%
  summarise(인구수 = sum(인구수))

km_year_mon_total_dong_gg <- km_year_mon_total_dong %>%
  mutate(인구수 = 인구수 / 10^4) %>%
  ggplot(aes(x=년월, y=인구수)) +
    geom_point(size = 0.5) +
    geom_line() +
    theme_bw(base_family = "Malgun Gothic") +
    labs(title = "광명시 동별 유동인구",
         subtitle = "2018년 1월 ~ 2022년 12월",
         x = "",
         y = "유동인구(만명)",
         caption = "데이터 출처: KT 유동인구 데이터(경기도 데이터분석센터") +
    scale_y_continuous(labels = scales::comma) +
    facet_wrap(~ADMI_NM)

km_year_mon_total_dong_gg

ragg::agg_png("images/KT/광명시_월별_동별_유동인구.png",
              width = 10, height = 7, units = "in", res = 600)
km_year_mon_total_dong_gg
dev.off()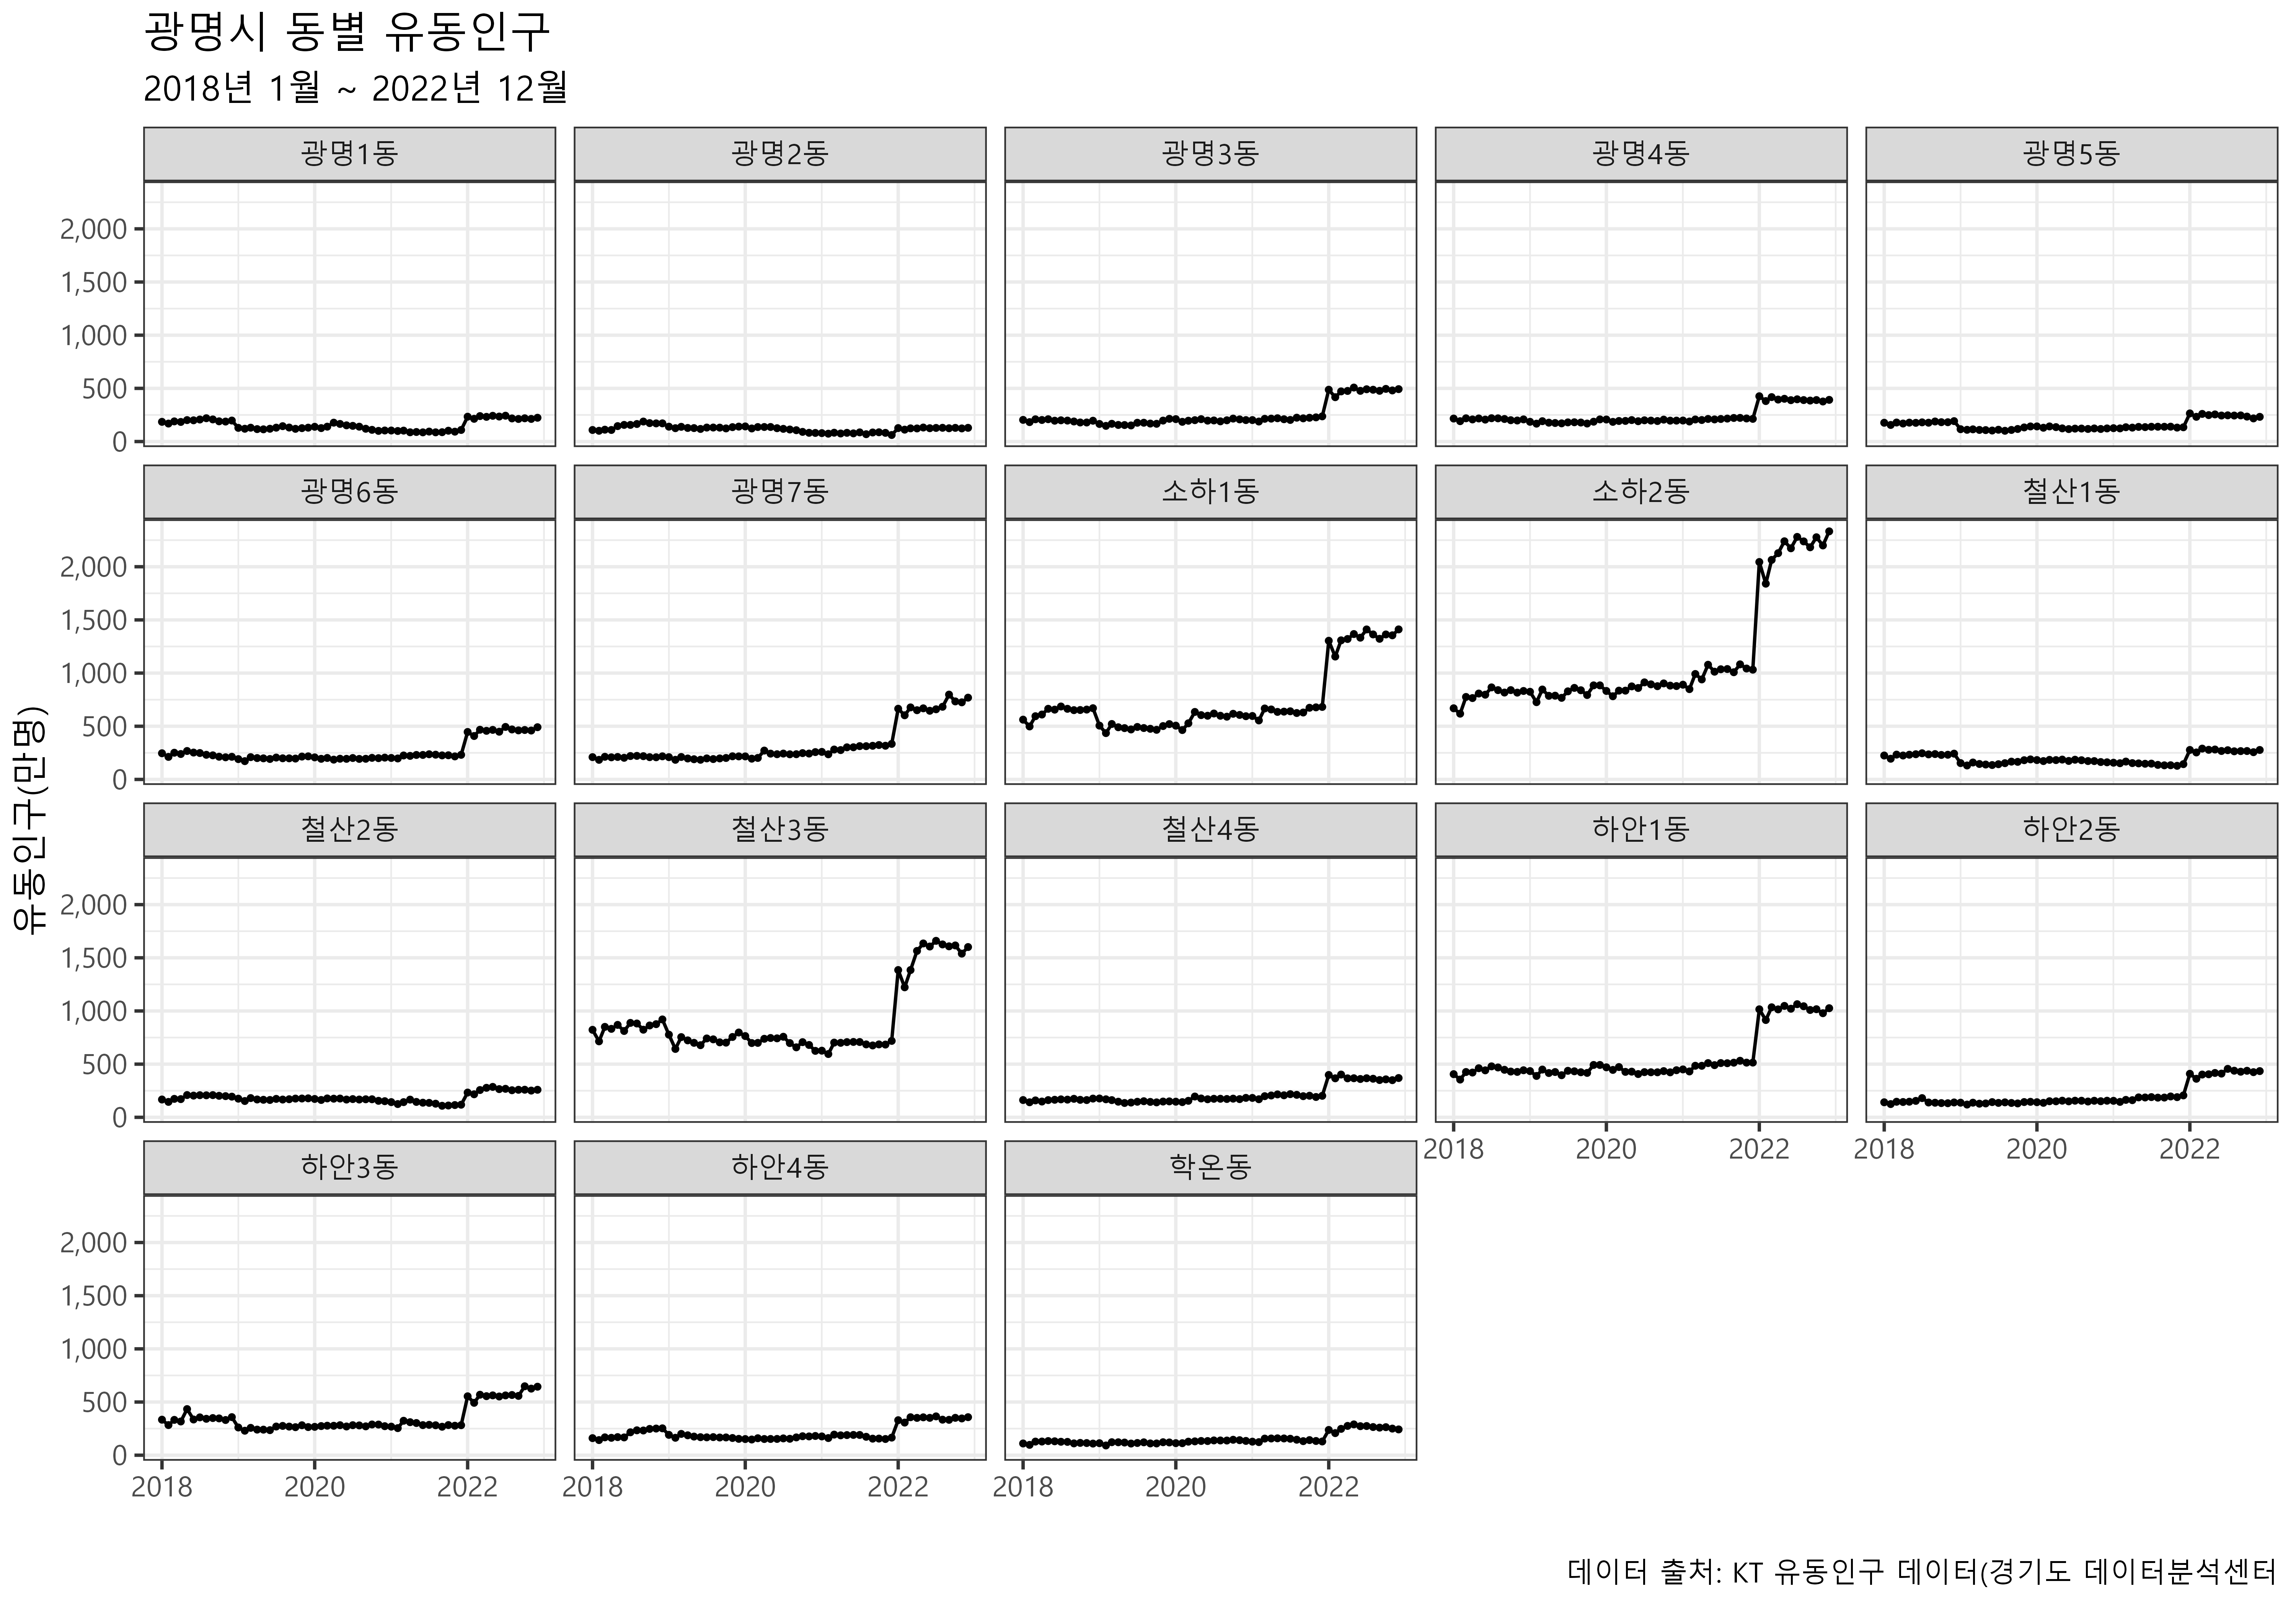
km_year_mon_total_dong_sex <- km_age_sex_yearmon_tbl %>%
  group_by(년월, ADMI_NM, 성별) %>%
  summarise(인구수 = sum(인구수))

km_year_mon_total_dong_sex_gg <- km_year_mon_total_dong_sex %>%
  mutate(인구수 = 인구수 / 10^4) %>%
  ggplot(aes(x=년월, y=인구수, color = 성별)) +
    geom_point(size = 0.5) +
    geom_line() +
    theme_bw(base_family = "Malgun Gothic") +
    labs(title = "광명시 동별 유동인구",
         subtitle = "2018년 1월 ~ 2022년 12월",
         x = "",
         y = "유동인구(만명)",
         caption = "데이터 출처: KT 유동인구 데이터(경기도 데이터분석센터") +
    scale_y_continuous(labels = scales::comma) +
    facet_wrap(~ADMI_NM) +
    scale_color_manual(values = c("남성" = "blue", "여성" = "black"))

km_year_mon_total_dong_sex_gg

ragg::agg_png("images/KT/광명시_월별_동별_성별_유동인구.png",
              width = 10, height = 7, units = "in", res = 600)
km_year_mon_total_dong_sex_gg
dev.off()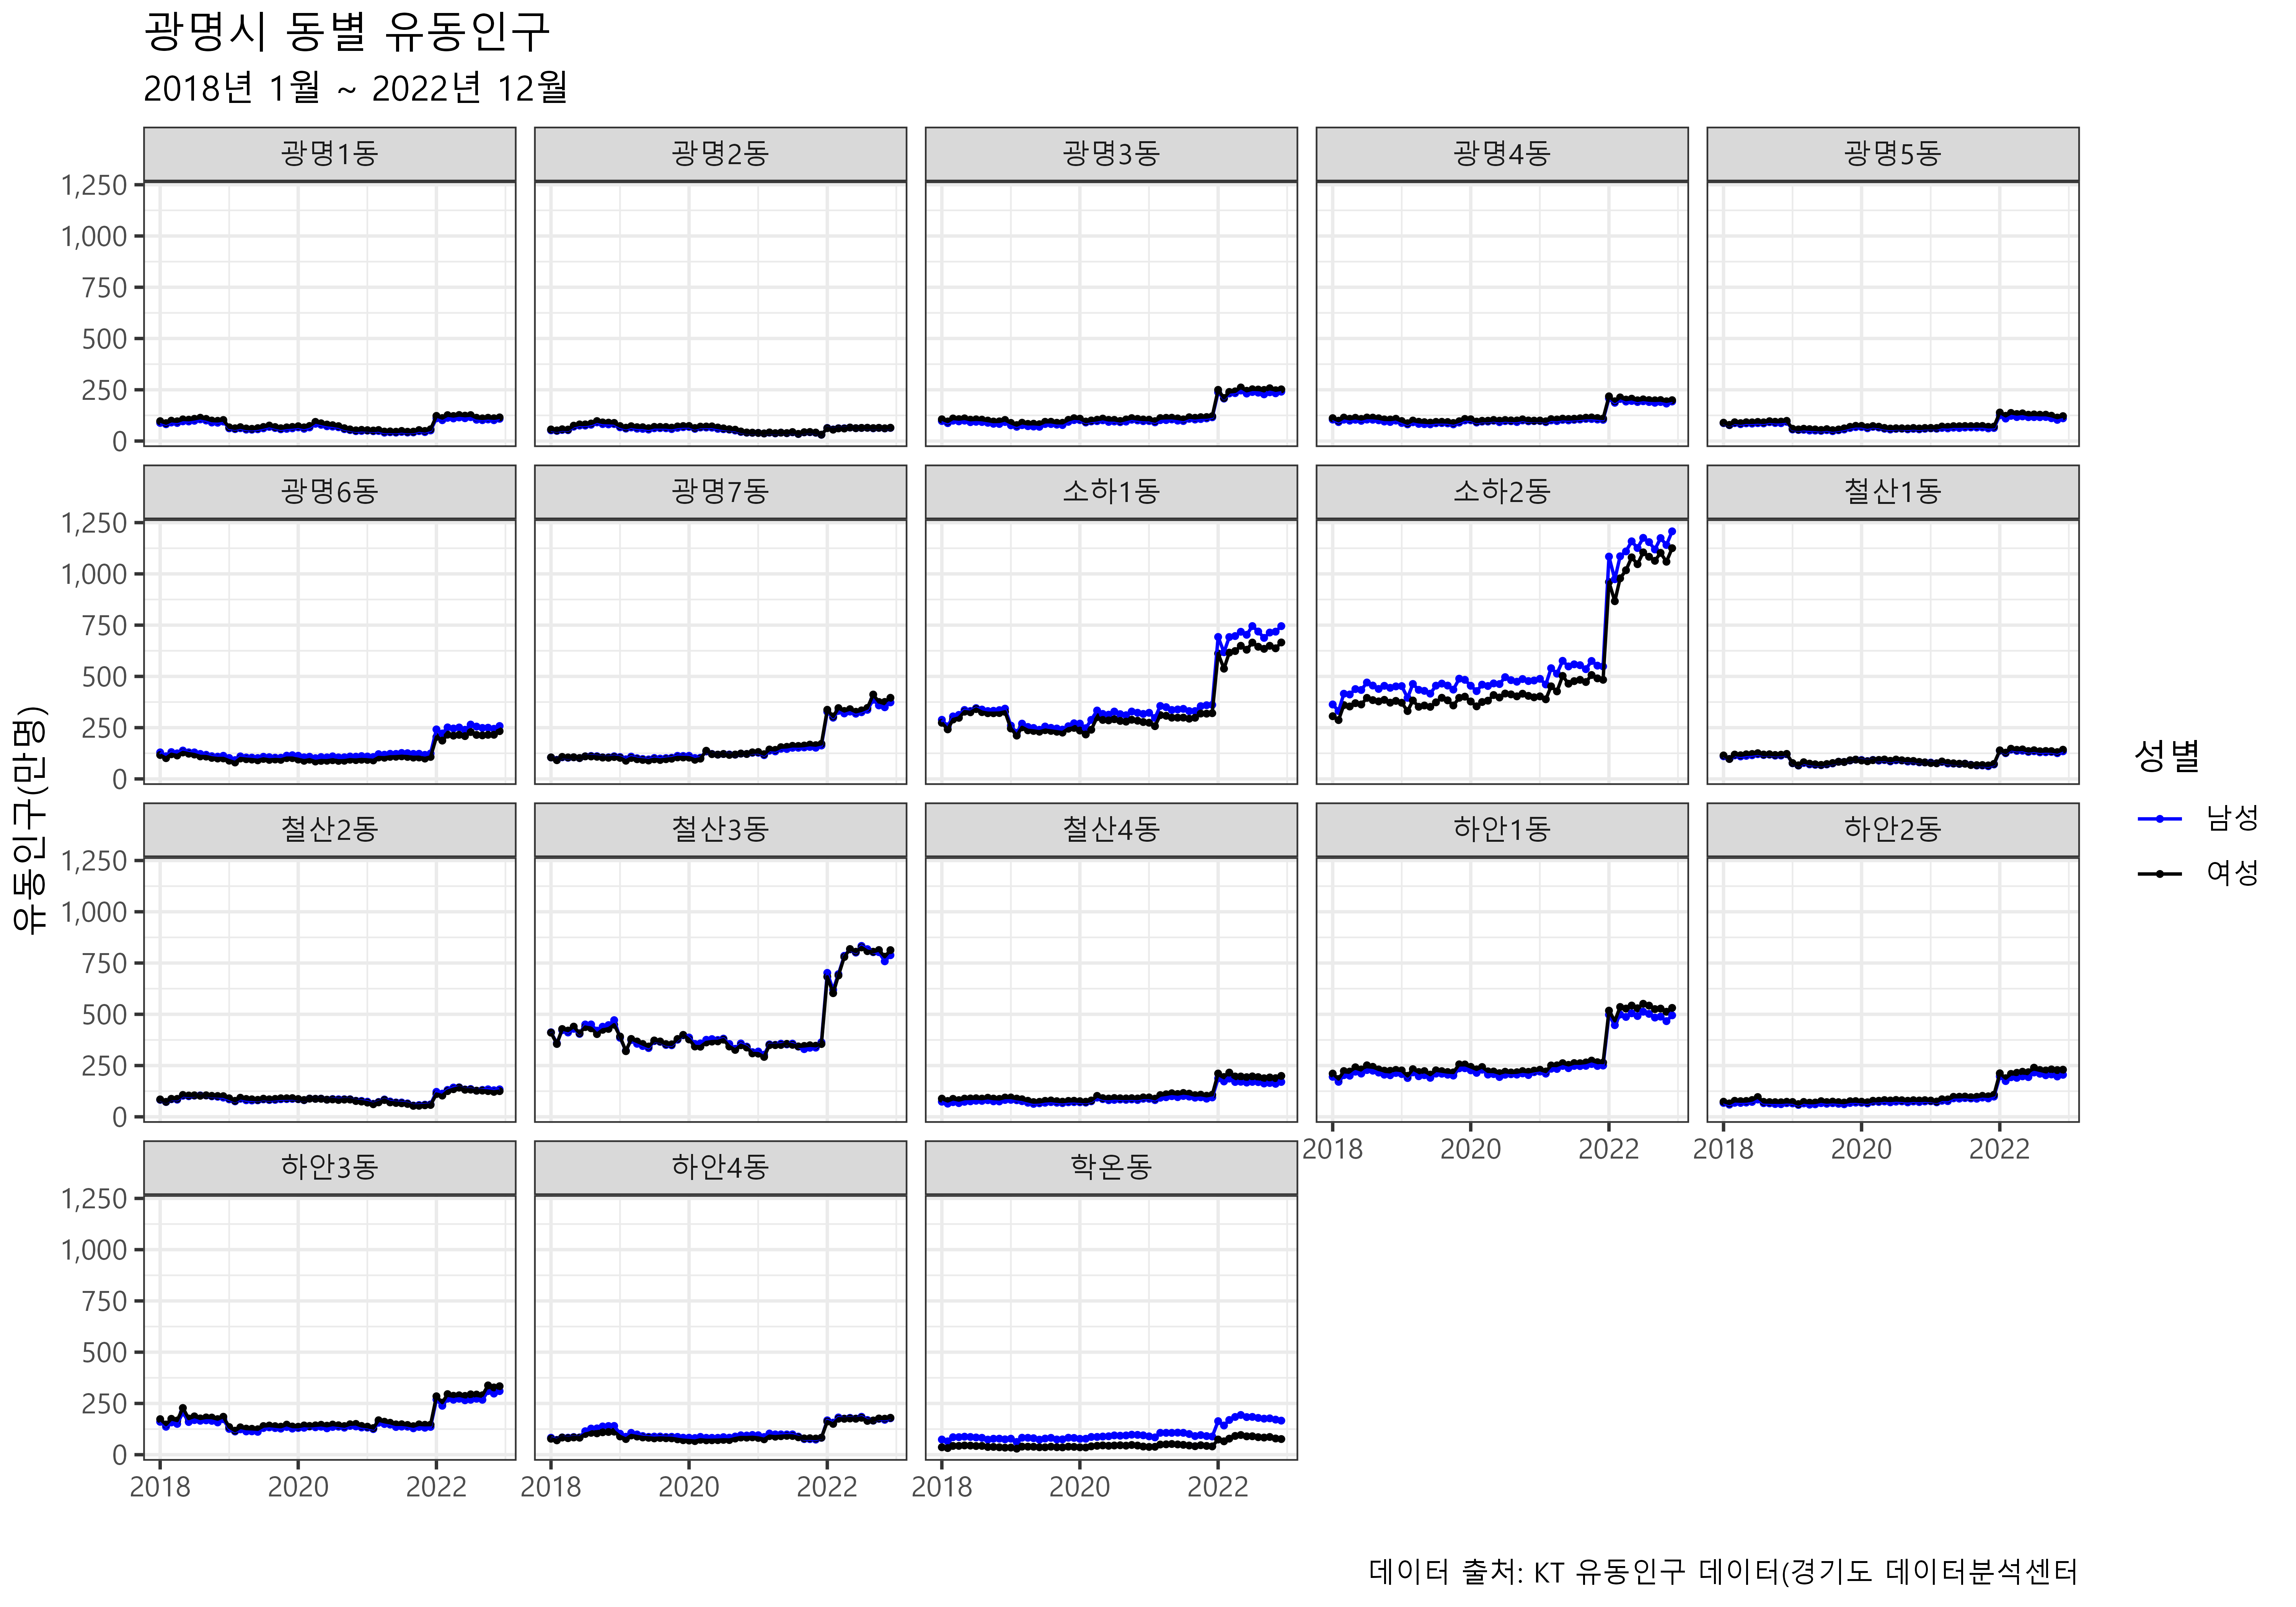
library(hrbrthemes)

km_year_mon_total_dong_age <- km_age_sex_yearmon_tbl %>%
  mutate(세대별 = case_when(연령대 %in% c("00_09", "10_19") ~ "00~19",
                            연령대 %in% c("20_29") ~ "20~29",
                            연령대 %in% c("30_39", "40_49") ~ "30~49",
                            연령대 %in% c("50_59") ~ "50~59",
                            연령대 %in% c("60_up") ~ "60~이상")) %>%
  group_by(년월, ADMI_NM, 세대별) %>%
  summarise(인구수 = sum(인구수))

km_year_mon_total_dong_age_gg <- km_year_mon_total_dong_age %>%
  mutate(인구수 = 인구수 / 10^4) %>%
  ggplot(aes(x=년월, y=인구수, color = 세대별)) +
    geom_point(size = 0.5) +
    geom_line() +
    theme_minimal(base_family = "Malgun Gothic") +
    labs(title = "광명시 세대별 유동인구",
         subtitle = "2018년 1월 ~ 2022년 12월",
         x = "",
         y = "유동인구(만명)",
         caption = "데이터 출처: KT 유동인구 데이터(경기도 데이터분석센터") +
    scale_y_continuous(labels = scales::comma) +
    facet_wrap(~ADMI_NM)

km_year_mon_total_dong_age_gg

ragg::agg_png("images/KT/광명시_월별_동별_세대별_유동인구.png",
              width = 10, height = 7, units = "in", res = 600)
km_year_mon_total_dong_age_gg
dev.off()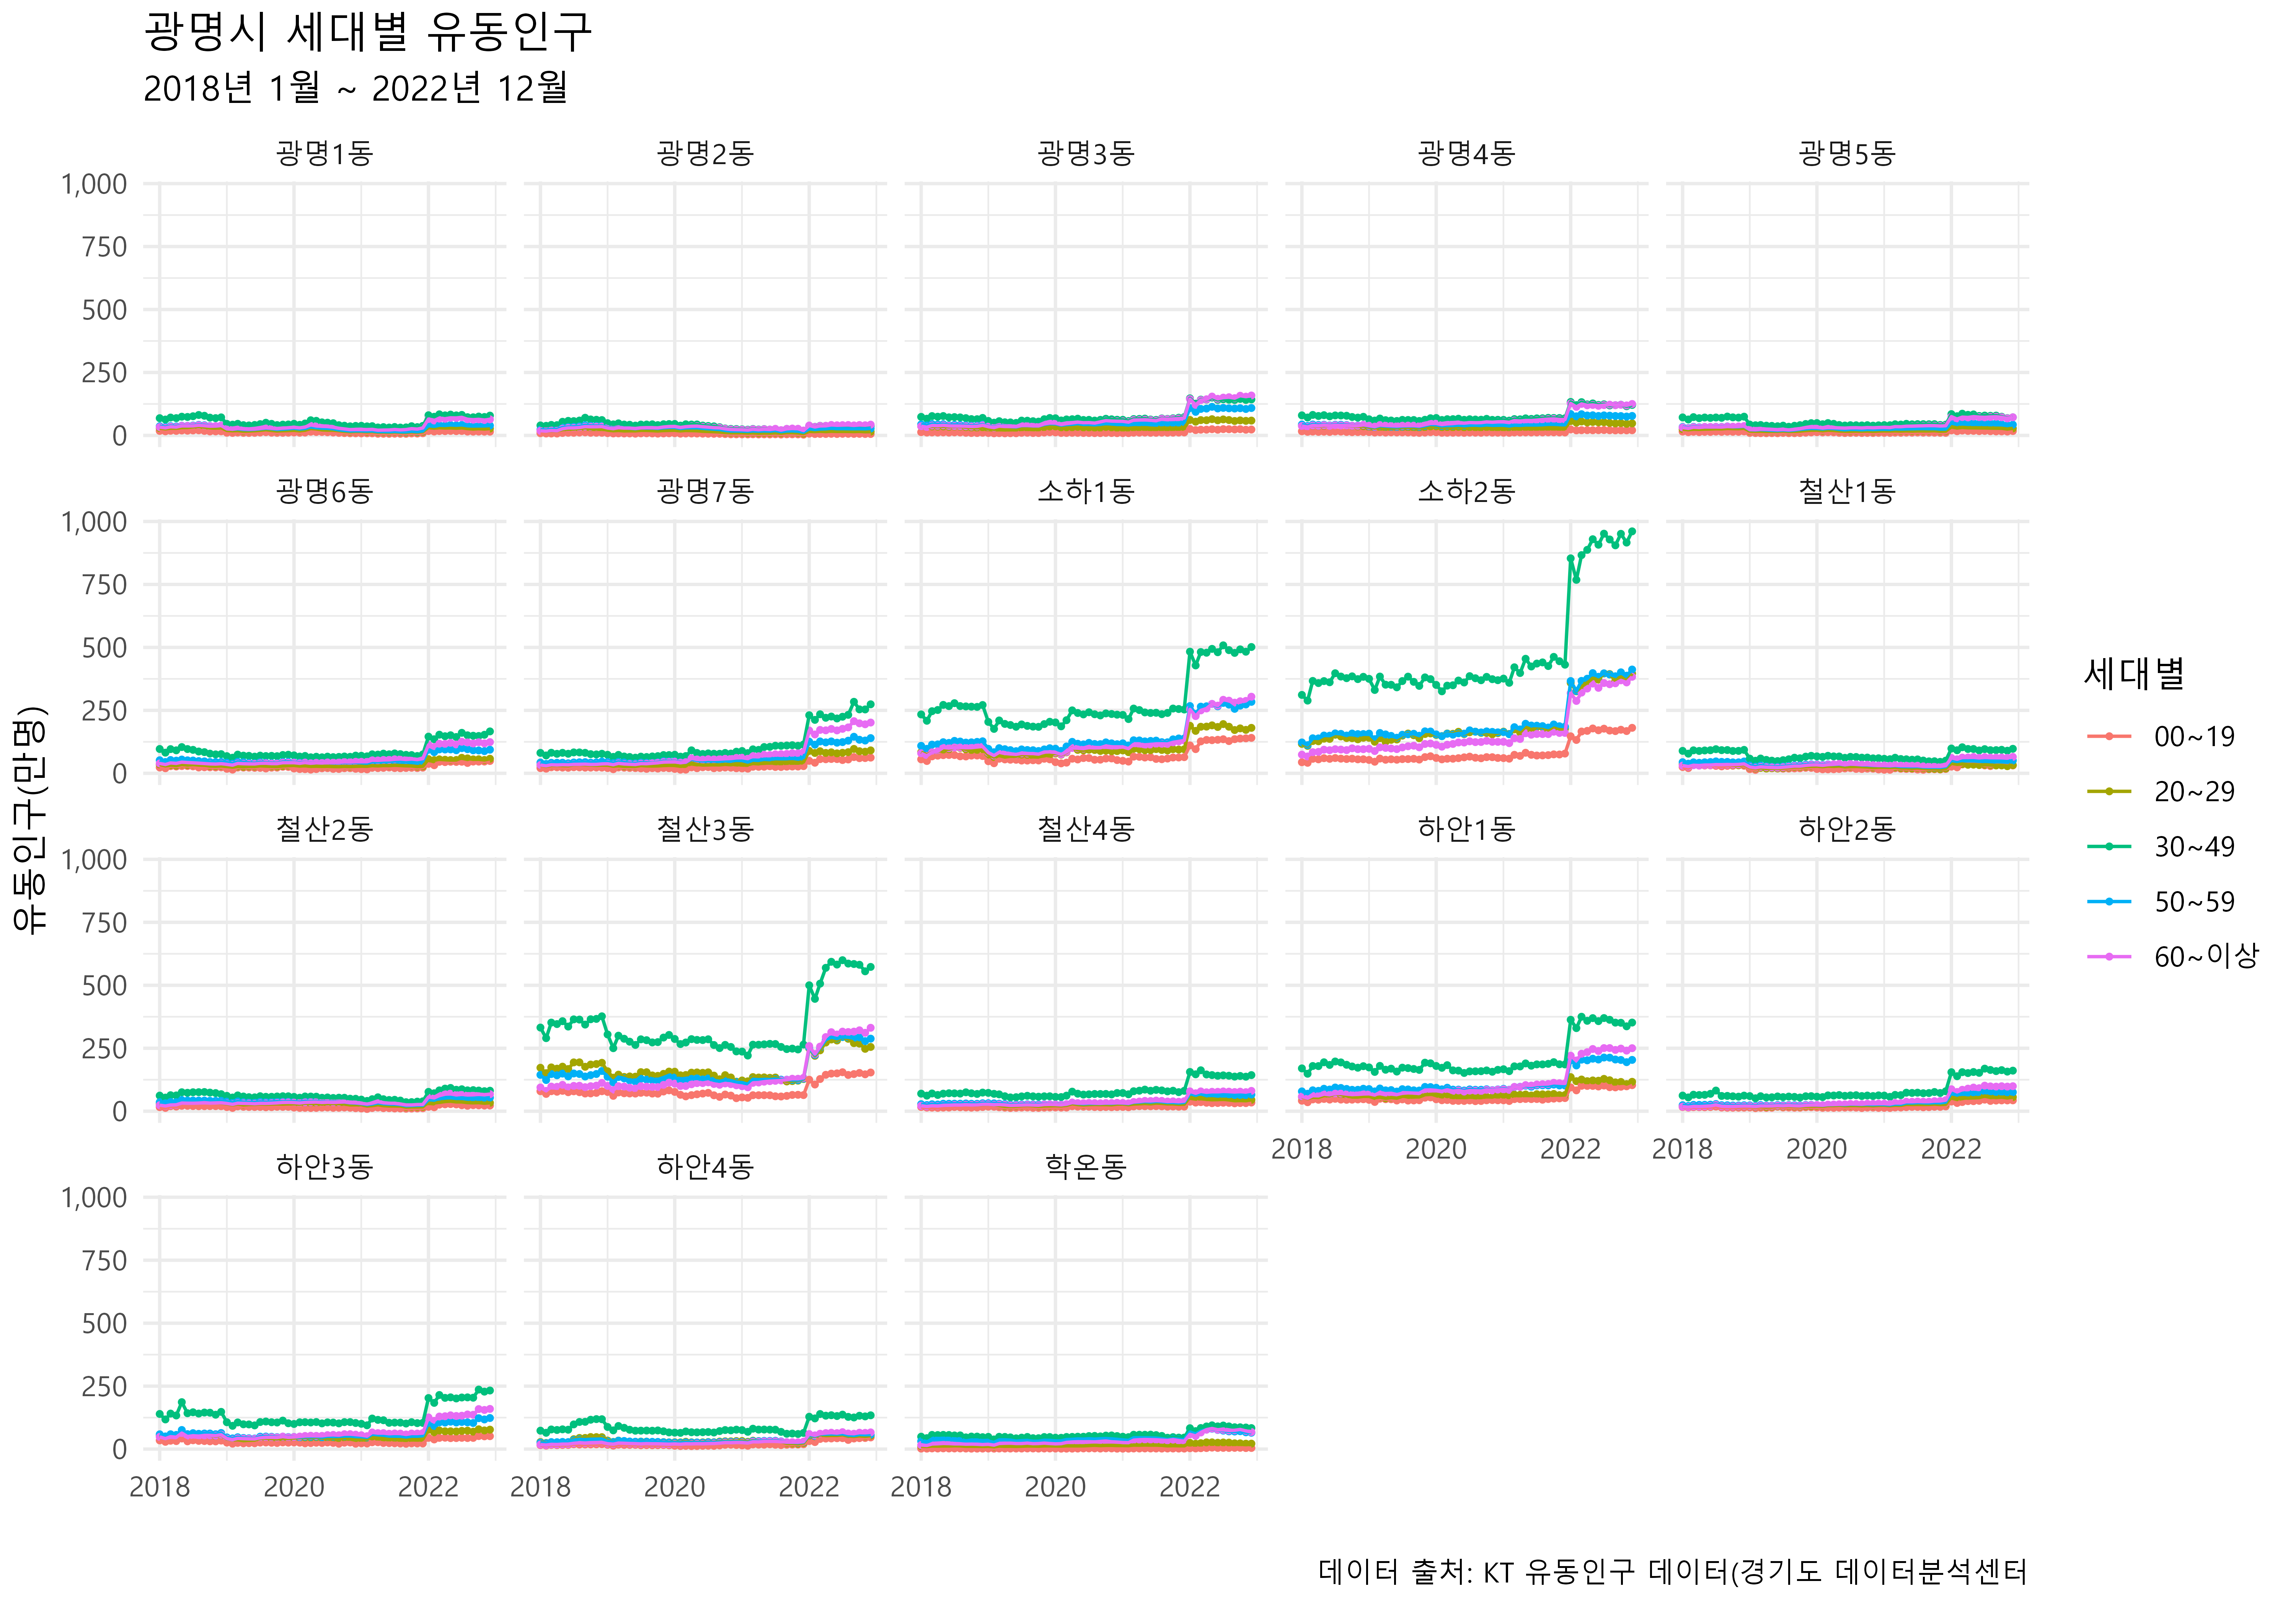
library(classInt)
extrafont::loadfonts()

km_dong_raw <- km_age_sex_yearmon_tbl %>%
  filter(ADMI_NM == "소하2동")

km_dong_tbl <- km_dong_raw %>%
  mutate(년도 = year(년월)) %>%
  group_by(cell_id,  x_axis, y_axis, 년도) %>%
  summarise(인구수 = sum(인구수) / 10^4) %>%
  ungroup()


breaks <- classInt::classIntervals(
    km_dong_tbl$인구수,
    n = 5,
    style = "fisher"
)$brks

vmin <- min(
    km_dong_tbl$인구수,
    na.rm = T
)

vmax <- max(
    km_dong_tbl$인구수,
    na.rm = T
)

km_dong_sf <- st_as_sf(x = km_dong_tbl,
        coords = c("x_axis", "y_axis"),
        crs = st_crs(km_map))

km_dong_year_gg <- km_dong_sf %>%
  ggplot() +
    geom_sf(aes(geometry=geometry, size = 인구수), alpha=0.3) +
    facet_wrap(~년도, nrow = 1) +
    scale_size_continuous(
      breaks = round(breaks, 0),
      range = c(1, 5),
      limits = c(vmin, vmax),
      name = "유동인구") +
    theme_minimal(base_family = "Malgun Gothic") +
    labs(title = "광명시 소하2동 연도별 유동인구",
         subtitle = "2018년 1월 ~ 2022년 12월",
         x = "",
         y = "",
         size = "유동인구(만명)",
         caption = "데이터 출처: KT 유동인구 데이터(경기도 데이터분석센터") +
    guides(size = guide_legend(nrow = 1)) +
    theme(legend.position = "bottom")


km_dong_year_gg

ragg::agg_png("images/KT/광명시_소하2동_연도별_유동인구.png",
              width = 10, height = 5, units = "in", res = 600)
km_dong_year_gg
dev.off()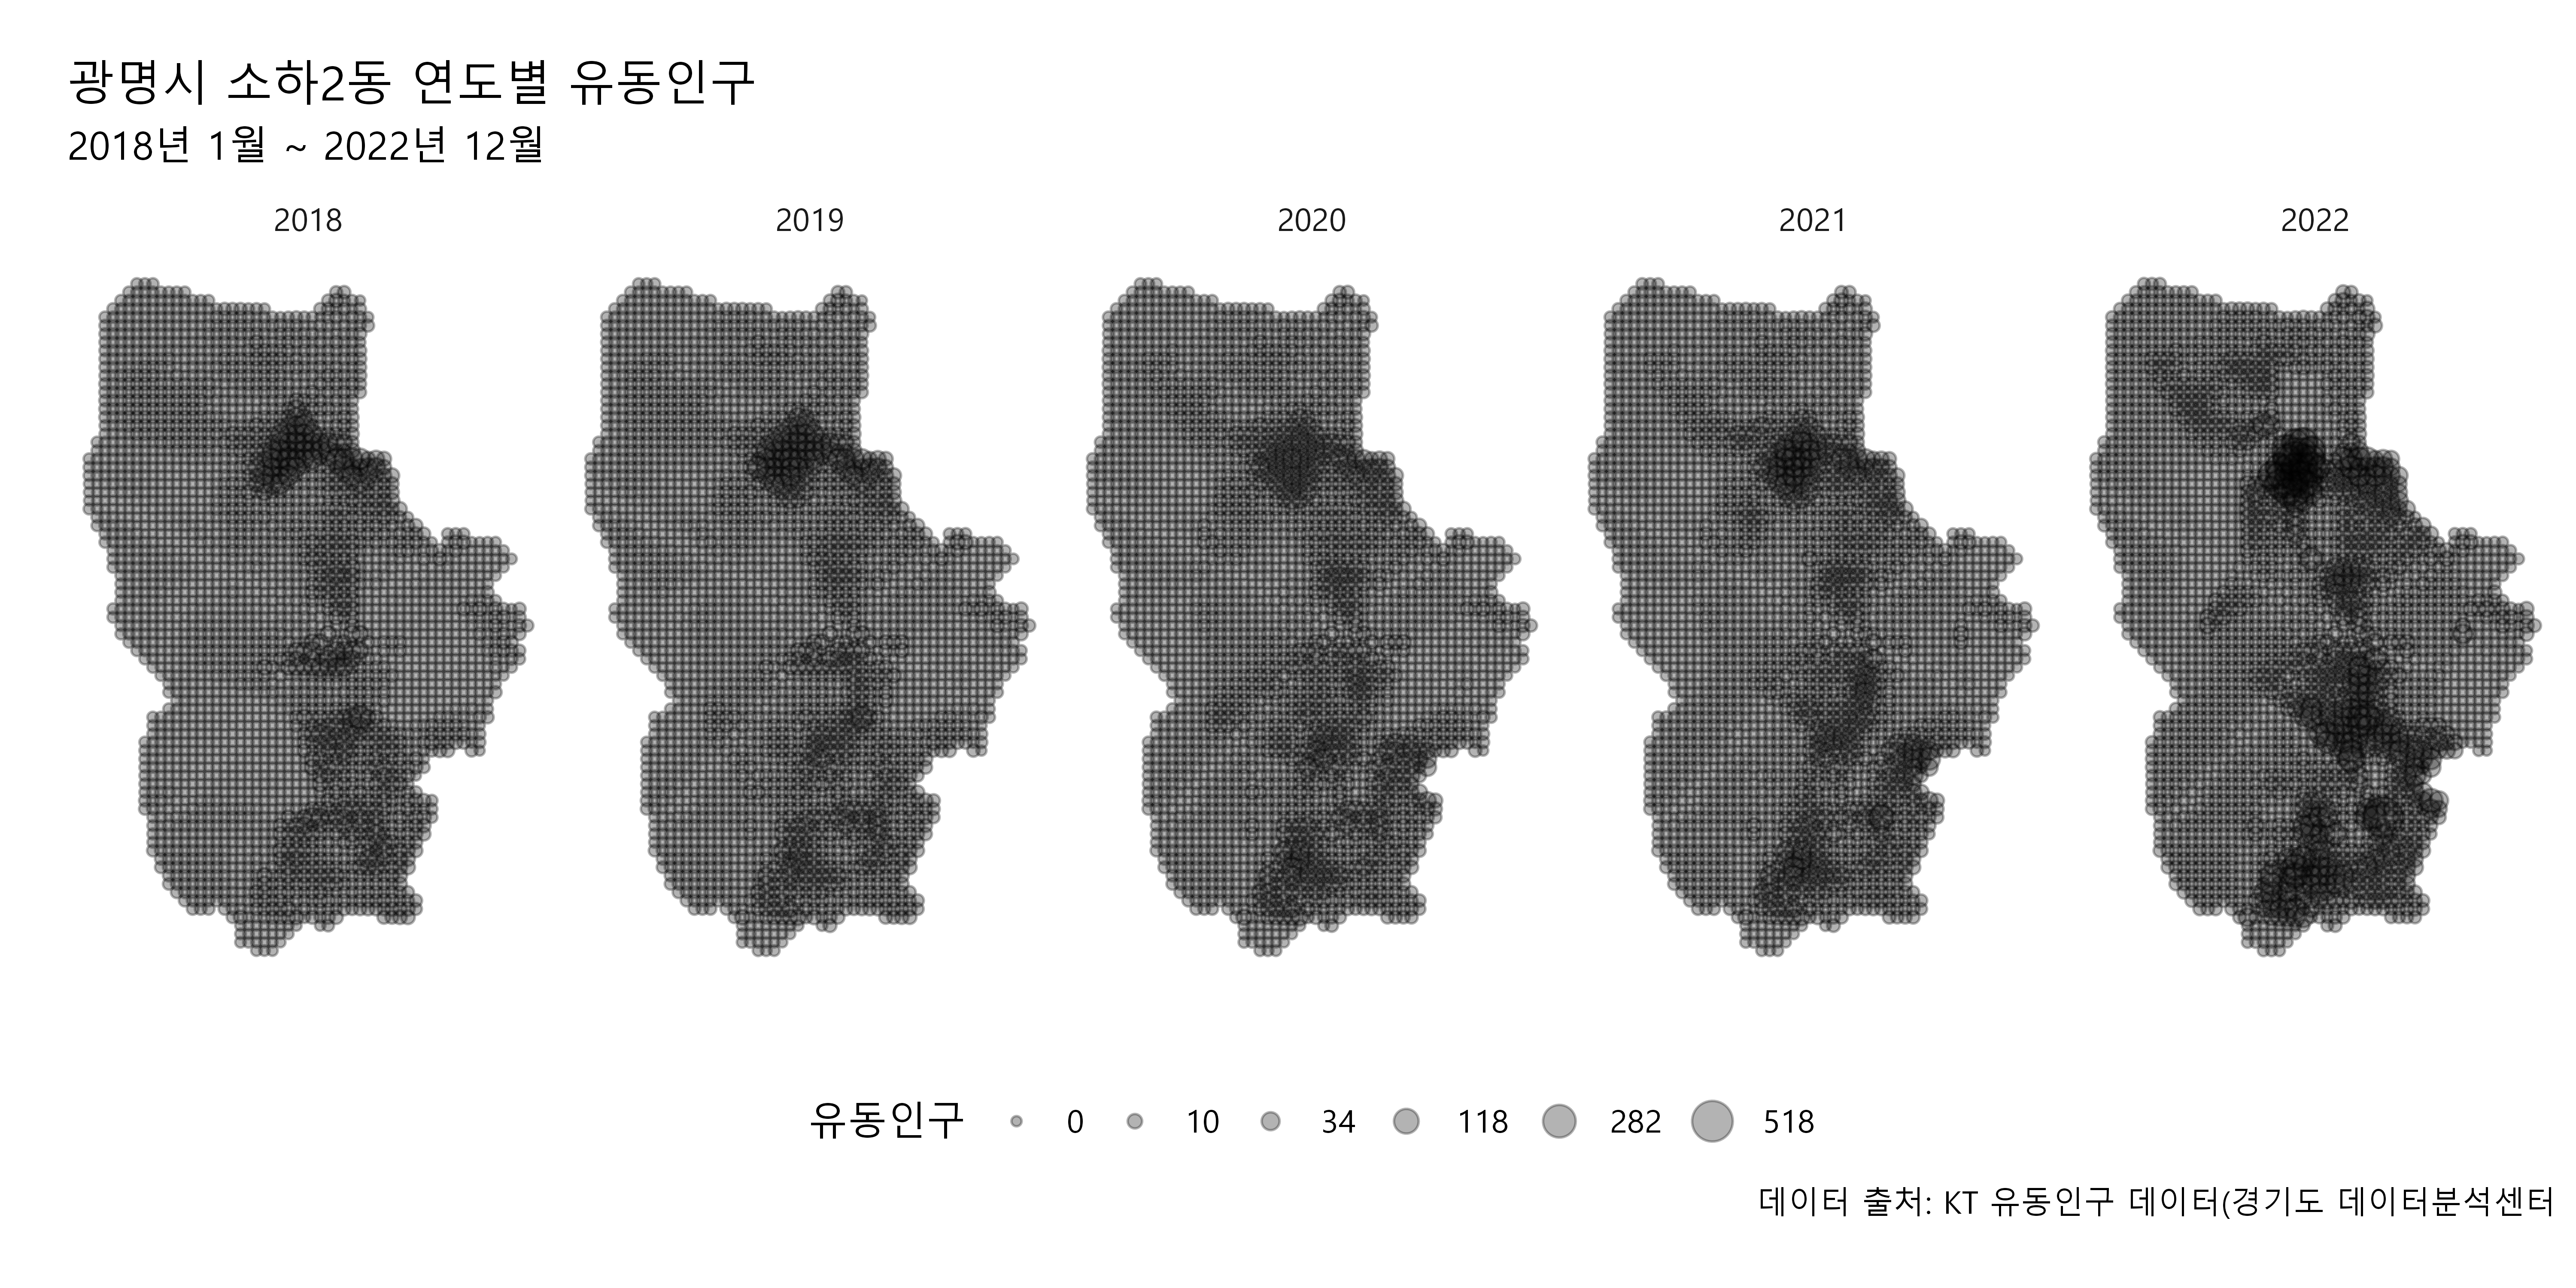
library(tidyverse)
library(janitor)
library(gt)
library(gtExtras)
library(sf)
library(camcorder)


katec_crs <- "+proj=tmerc +lat_0=38 +lon_0=128 +k=0.9999 +x_0=400000 +y_0=600000 +ellps=bessel +units=m +no_defs"


gg_admin_map <-
st_read("data/(공통)셀블록도로행정동/행정동경계/행정동경계_경기도/tbshp_admi_gg_20210614.shp")

gg_admin_map <- gg_admin_map |> st_set_crs(katec_crs)

gg_city_map <- gg_admin_map |>
  janitor::clean_names() |>
  group_by(cty_nm) |>
  summarise(geometry = st_union(geometry))

st_geometry(gg_city_map) %>%
  plot()
library(sf)

port_tbl <- readxl::read_excel("data/국가어항.xlsx", sheet = "경기어항")

port_sf <- port_tbl |>
  # WGS84
  st_as_sf(coords = c("x", "y"), crs = 4326) |>
  # KATEC
  st_transform("+proj=tmerc +lat_0=38 +lon_0=128 +k=0.9999 +x_0=400000 +y_0=600000 +ellps=bessel +units=m +no_defs")

st_geometry(port_sf) |> plot()
gg_city_bbox <- st_bbox(gg_city_map)

gg_port_map_gg <- gg_city_map |>
  ggplot() +
    geom_sf() +
    ggrepel::geom_text_repel(
      data = gg_city_map,
        aes(label = cty_nm, geometry = geometry), stat = "sf_coordinates",
        min.segment.length = 1, size = 4, max.overlaps = Inf,
      family = "MaruBrui"
    ) +
    geom_sf(data=port_sf, size = 2, color = "red") +
    ggrepel::geom_text_repel(
      data = port_sf,
        aes(label = 어항명, geometry = geometry), stat = "sf_coordinates",
        min.segment.length = 1, size = 5, max.overlaps = Inf,
        hjust = 10,
        family = "MaruBrui", fontface = 'bold'
    ) +
  coord_sf(xlim = c(gg_city_bbox['xmin']-10000,
                    gg_city_bbox['xmax']-50000),
           ylim = c(gg_city_bbox['ymin'],
                    gg_city_bbox['ymax'])) +
  theme(
    text = element_text(family = "MaruBuri", size = 24),
    title = element_text(family = "MaruBuri"),
    axis.title = element_text(family = "MaruBuri")
  ) +
  labs(title = "경기도 지방 항구",
       caption = "출처: 경기도 데이터분석센터") +
  theme_void(base_family = "MaruBuri")

gg_port_map_gg

ragg::agg_jpeg("images/항구_통계/01_경기도_어항_행정동.jpg",
              width = 10, height = 7, units = "in", res = 600)
gg_port_map_gg
dev.off()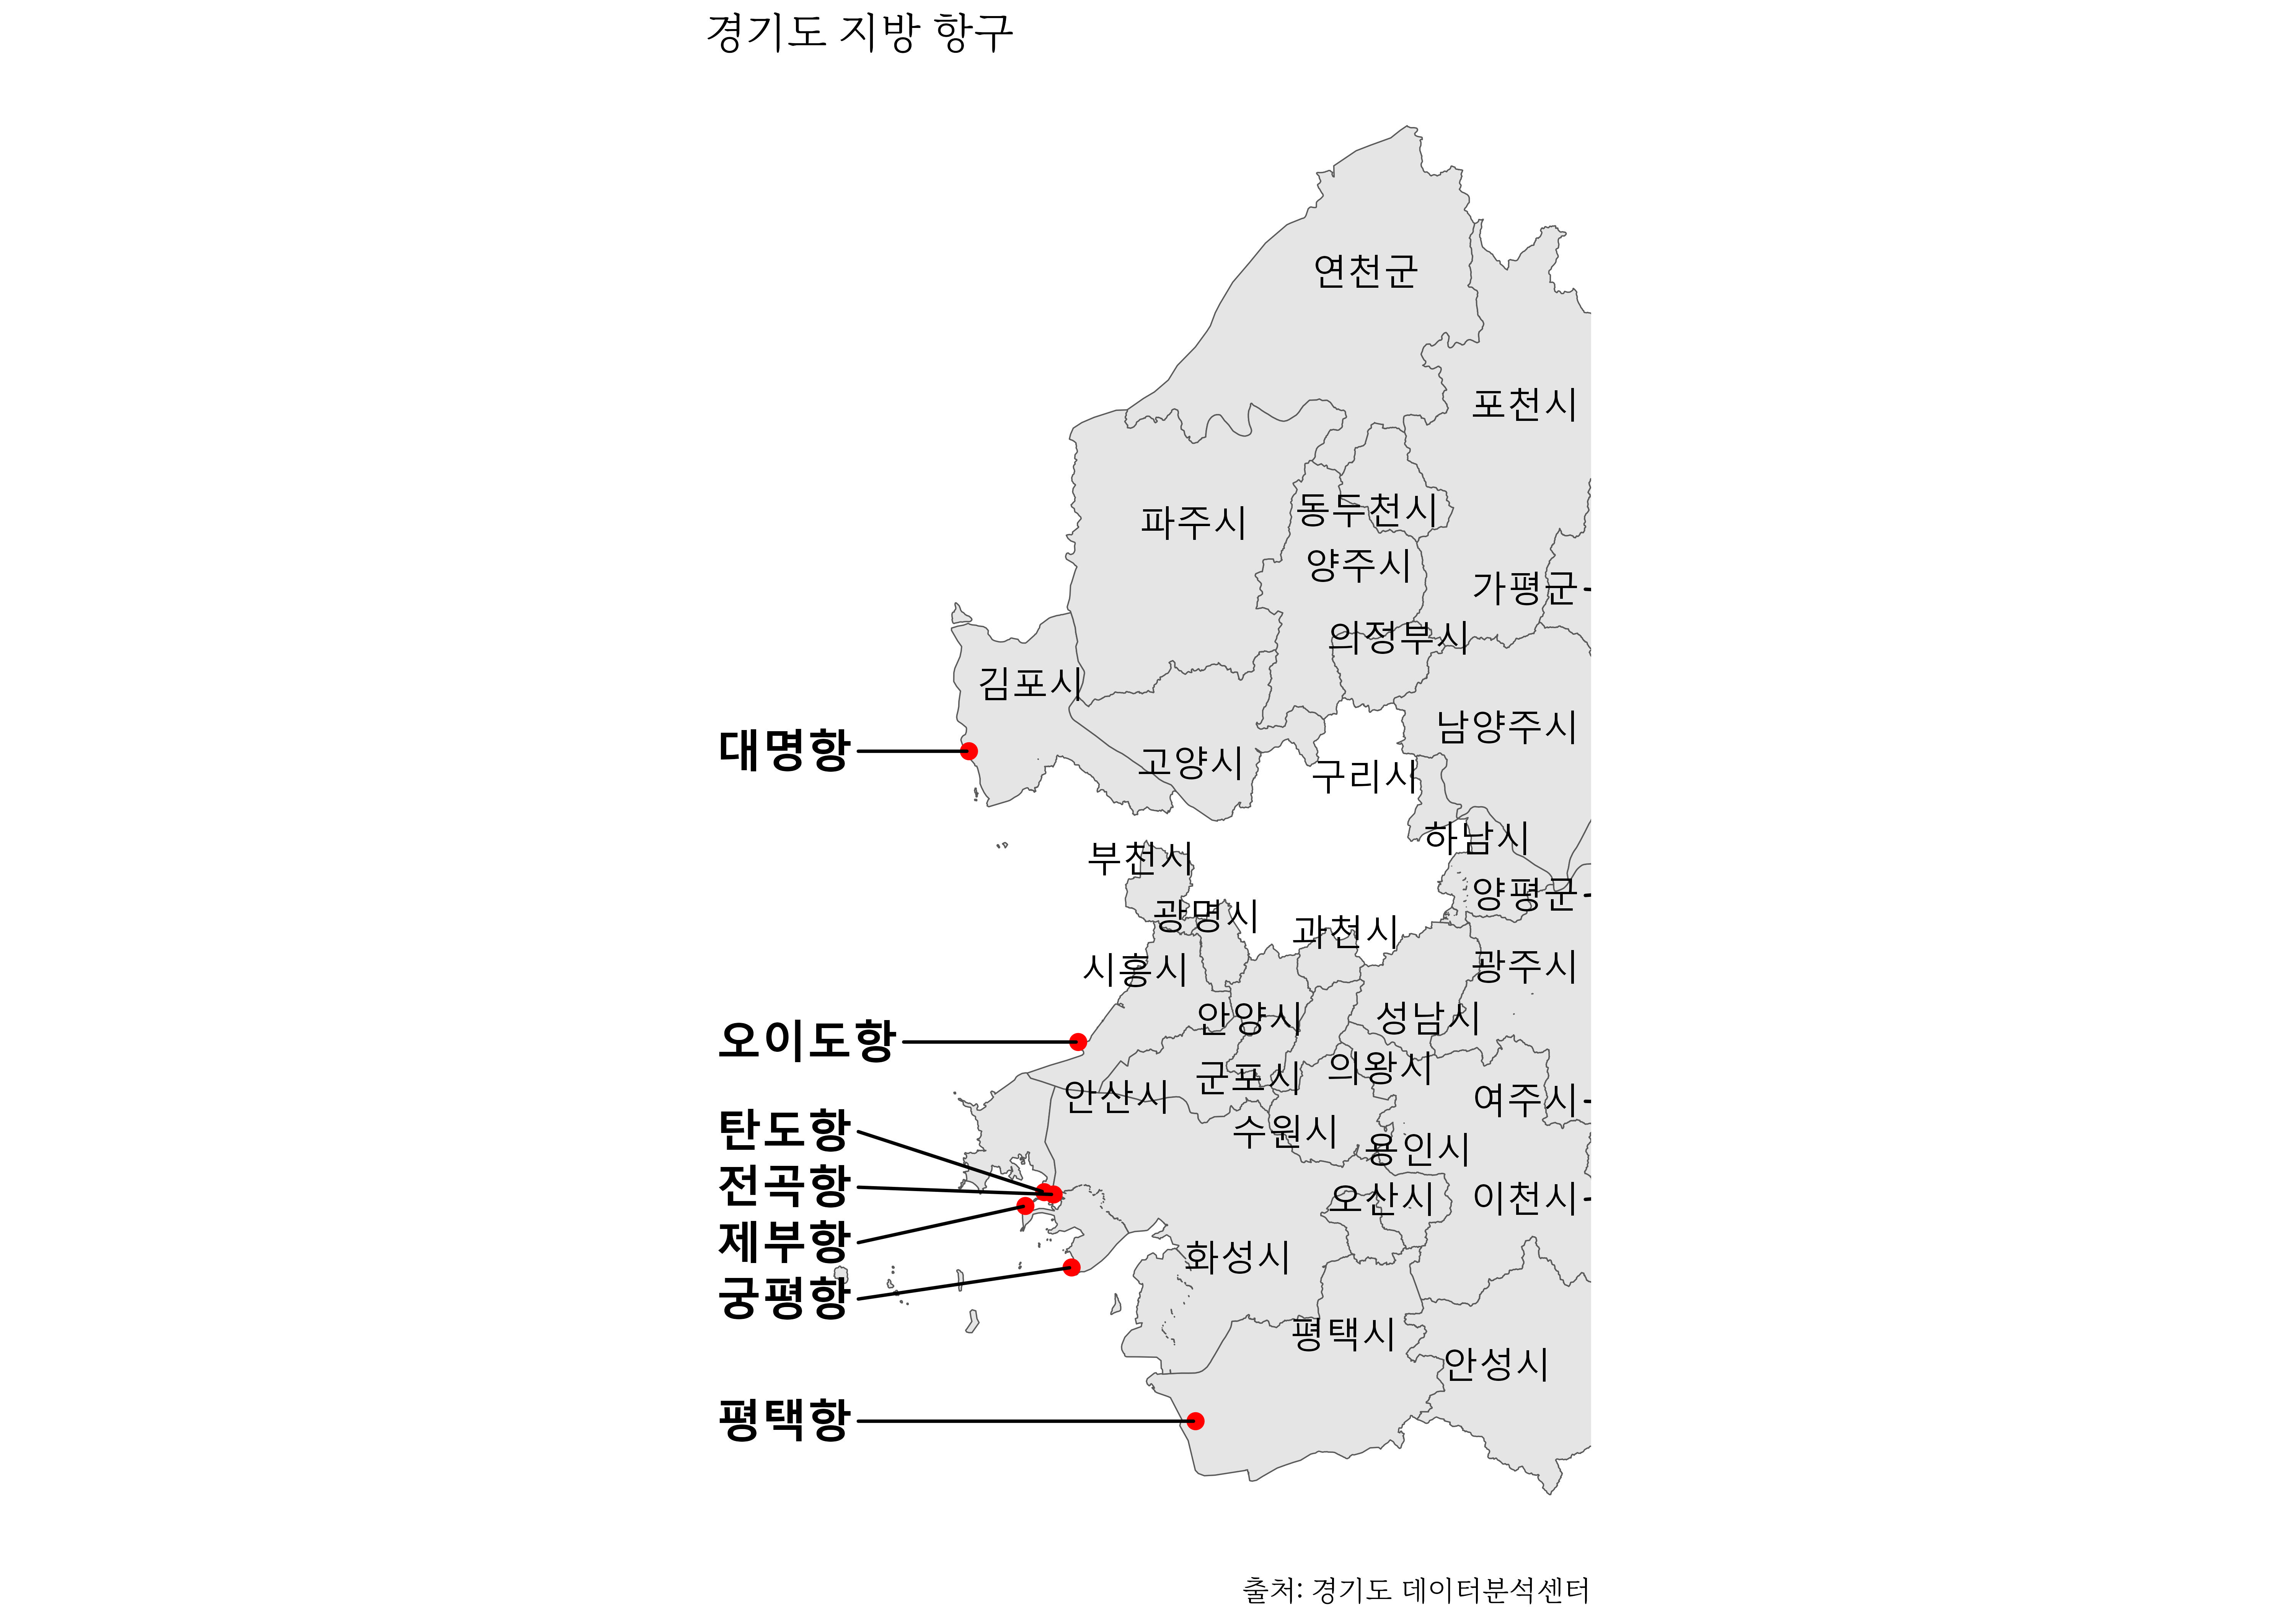
ports_adm_sf <- st_join(gg_admin_map, port_sf, maxdist = 1000,
                        join = nngeo::st_nn, left = FALSE) |>
  janitor::clean_names(ascii = FALSE) |>
  mutate(sgg_name = glue::glue("{어항명}"))
  # mutate(sgg_name = glue::glue("{어항명}: {cty_nm}"))

ports_adm_dong_gg <- ggplot() +
  geom_sf(data=ports_adm_sf) +
  ggrepel::geom_text_repel(
    data = port_sf,
      aes(label = 어항명, geometry = geometry), stat = "sf_coordinates",
      size = 3, max.overlaps = Inf, family = "MaruBrui") +
  geom_sf(data=port_sf, size = 1, color = "red", alpha=0.3) +
  coord_sf(xlim = c(gg_city_bbox['xmin']-10000,
                  gg_city_bbox['xmax']-60000),
         ylim = c(gg_city_bbox['ymin'],
                  gg_city_bbox['ymax']-65000)) +
  theme(
    text = element_text(family = "MaruBuri", size = 24),
    title = element_text(family = "MaruBuri"),
    axis.title = element_text(family = "MaruBuri")
  ) +
  labs(title = "경기도 지방 항구",
       subtitle = "지방항구 시군구 행정동",
       caption = "출처: 경기도 데이터분석센터") +
  theme_void(base_family = "MaruBuri")

ports_adm_dong_gg

ragg::agg_jpeg("images/항구_통계/01_경기도_어항_행정동_추출.jpg",
              width = 10, height = 7, units = "in", res = 600)
ports_adm_dong_gg
dev.off()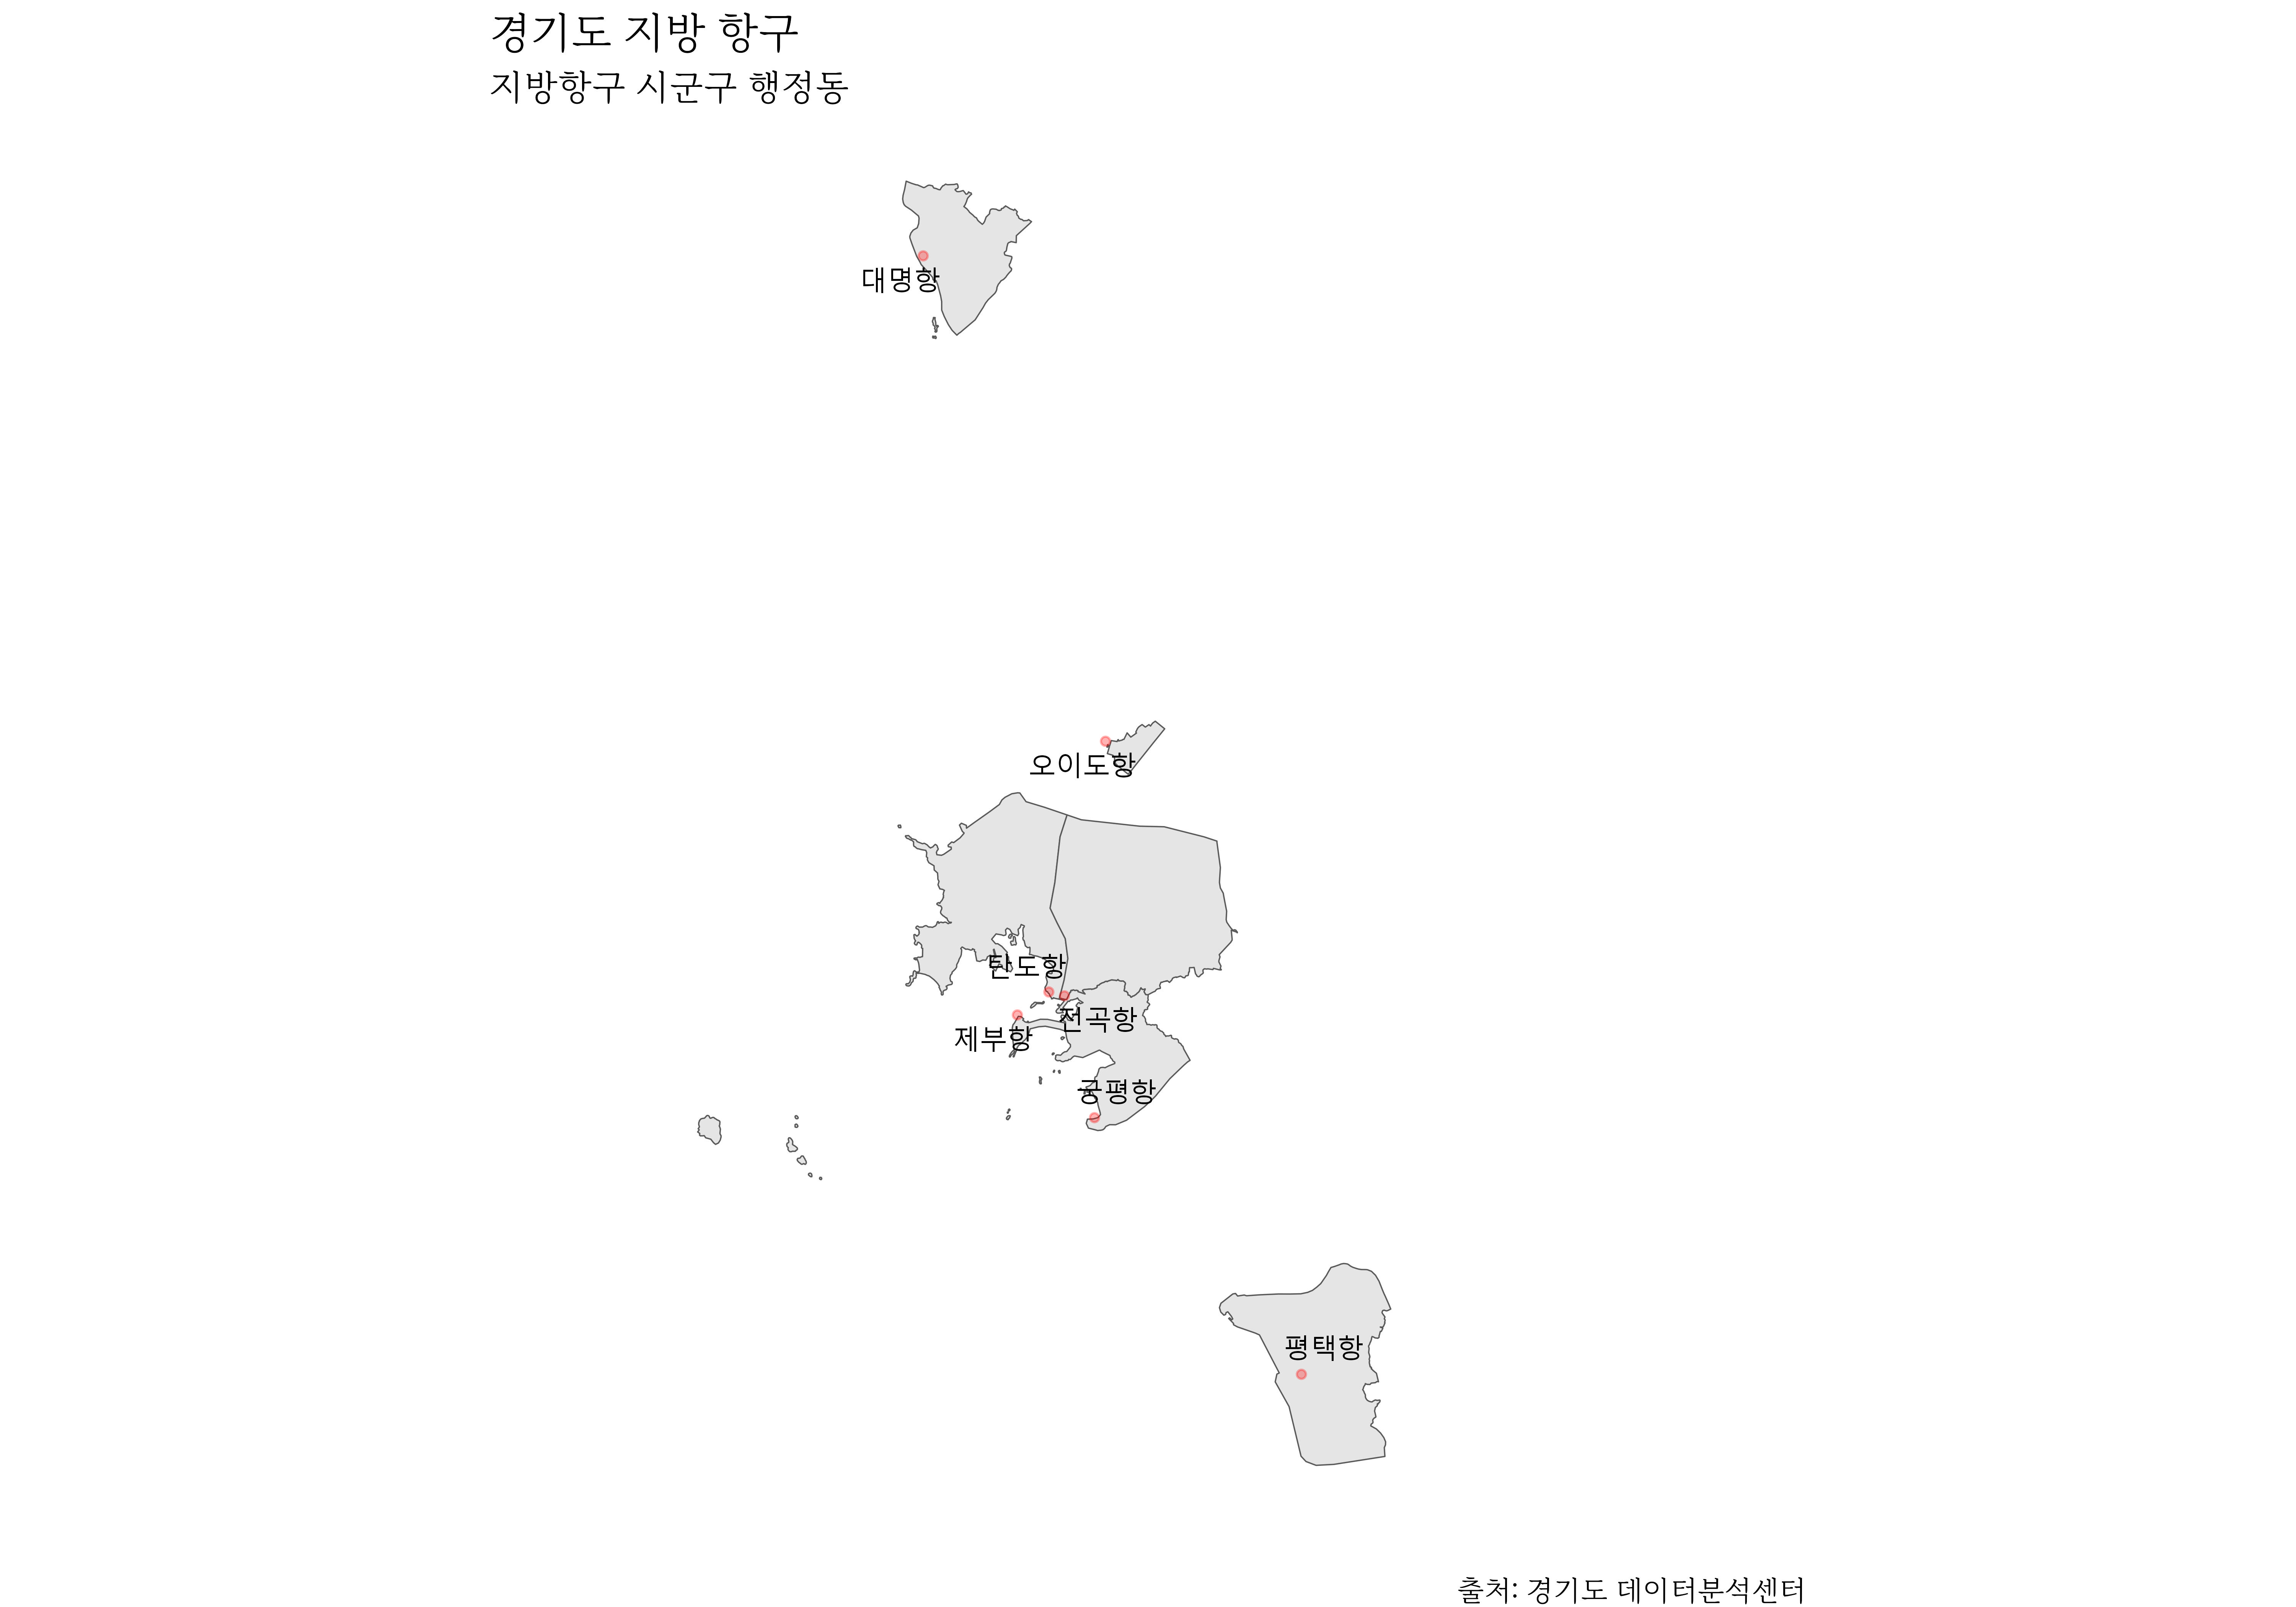
library(tidyverse)
library(janitor)
library(gt)
library(gtExtras)
library(sf)
library(patchwork)

katec_crs <- "+proj=tmerc +lat_0=38 +lon_0=128 +k=0.9999 +x_0=400000 +y_0=600000 +ellps=bessel +units=m +no_defs"

gg_admin_map <-
st_read("data/(공통)셀블록도로행정동/행정동경계/행정동경계_경기도/tbshp_admi_gg_20210614.shp")

gg_admin_map <- gg_admin_map |> st_set_crs(katec_crs)

gg_city_map <- gg_admin_map |>
  janitor::clean_names() |>
  group_by(cty_nm) |>
  summarise(geometry = st_union(geometry)) |>
  mutate(cty_target = ifelse(str_detect(cty_nm, "김포"), TRUE, FALSE))

gg_gimpo_gg <- ggplot() +
  geom_sf(data = gg_city_map, aes(fill = cty_target)) +
  theme_void(base_family = "MaruBuri") +
  scale_fill_manual(values = c("gray90", "skyblue")) +
  ggrepel::geom_text_repel(
      data = gg_city_map |> filter(cty_target == TRUE),
        aes(label = cty_nm, geometry = geometry), stat = "sf_coordinates",
        min.segment.length = 1, size = 4, max.overlaps = Inf,
      family = "MaruBrui") +
  theme(legend.position = "none")

gg_gimpo_gg

ragg::agg_jpeg("images/항구_통계/02_경기도_김포시.jpg",
              width = 10, height = 7, units = "in", res = 600)
gg_gimpo_gg
dev.off()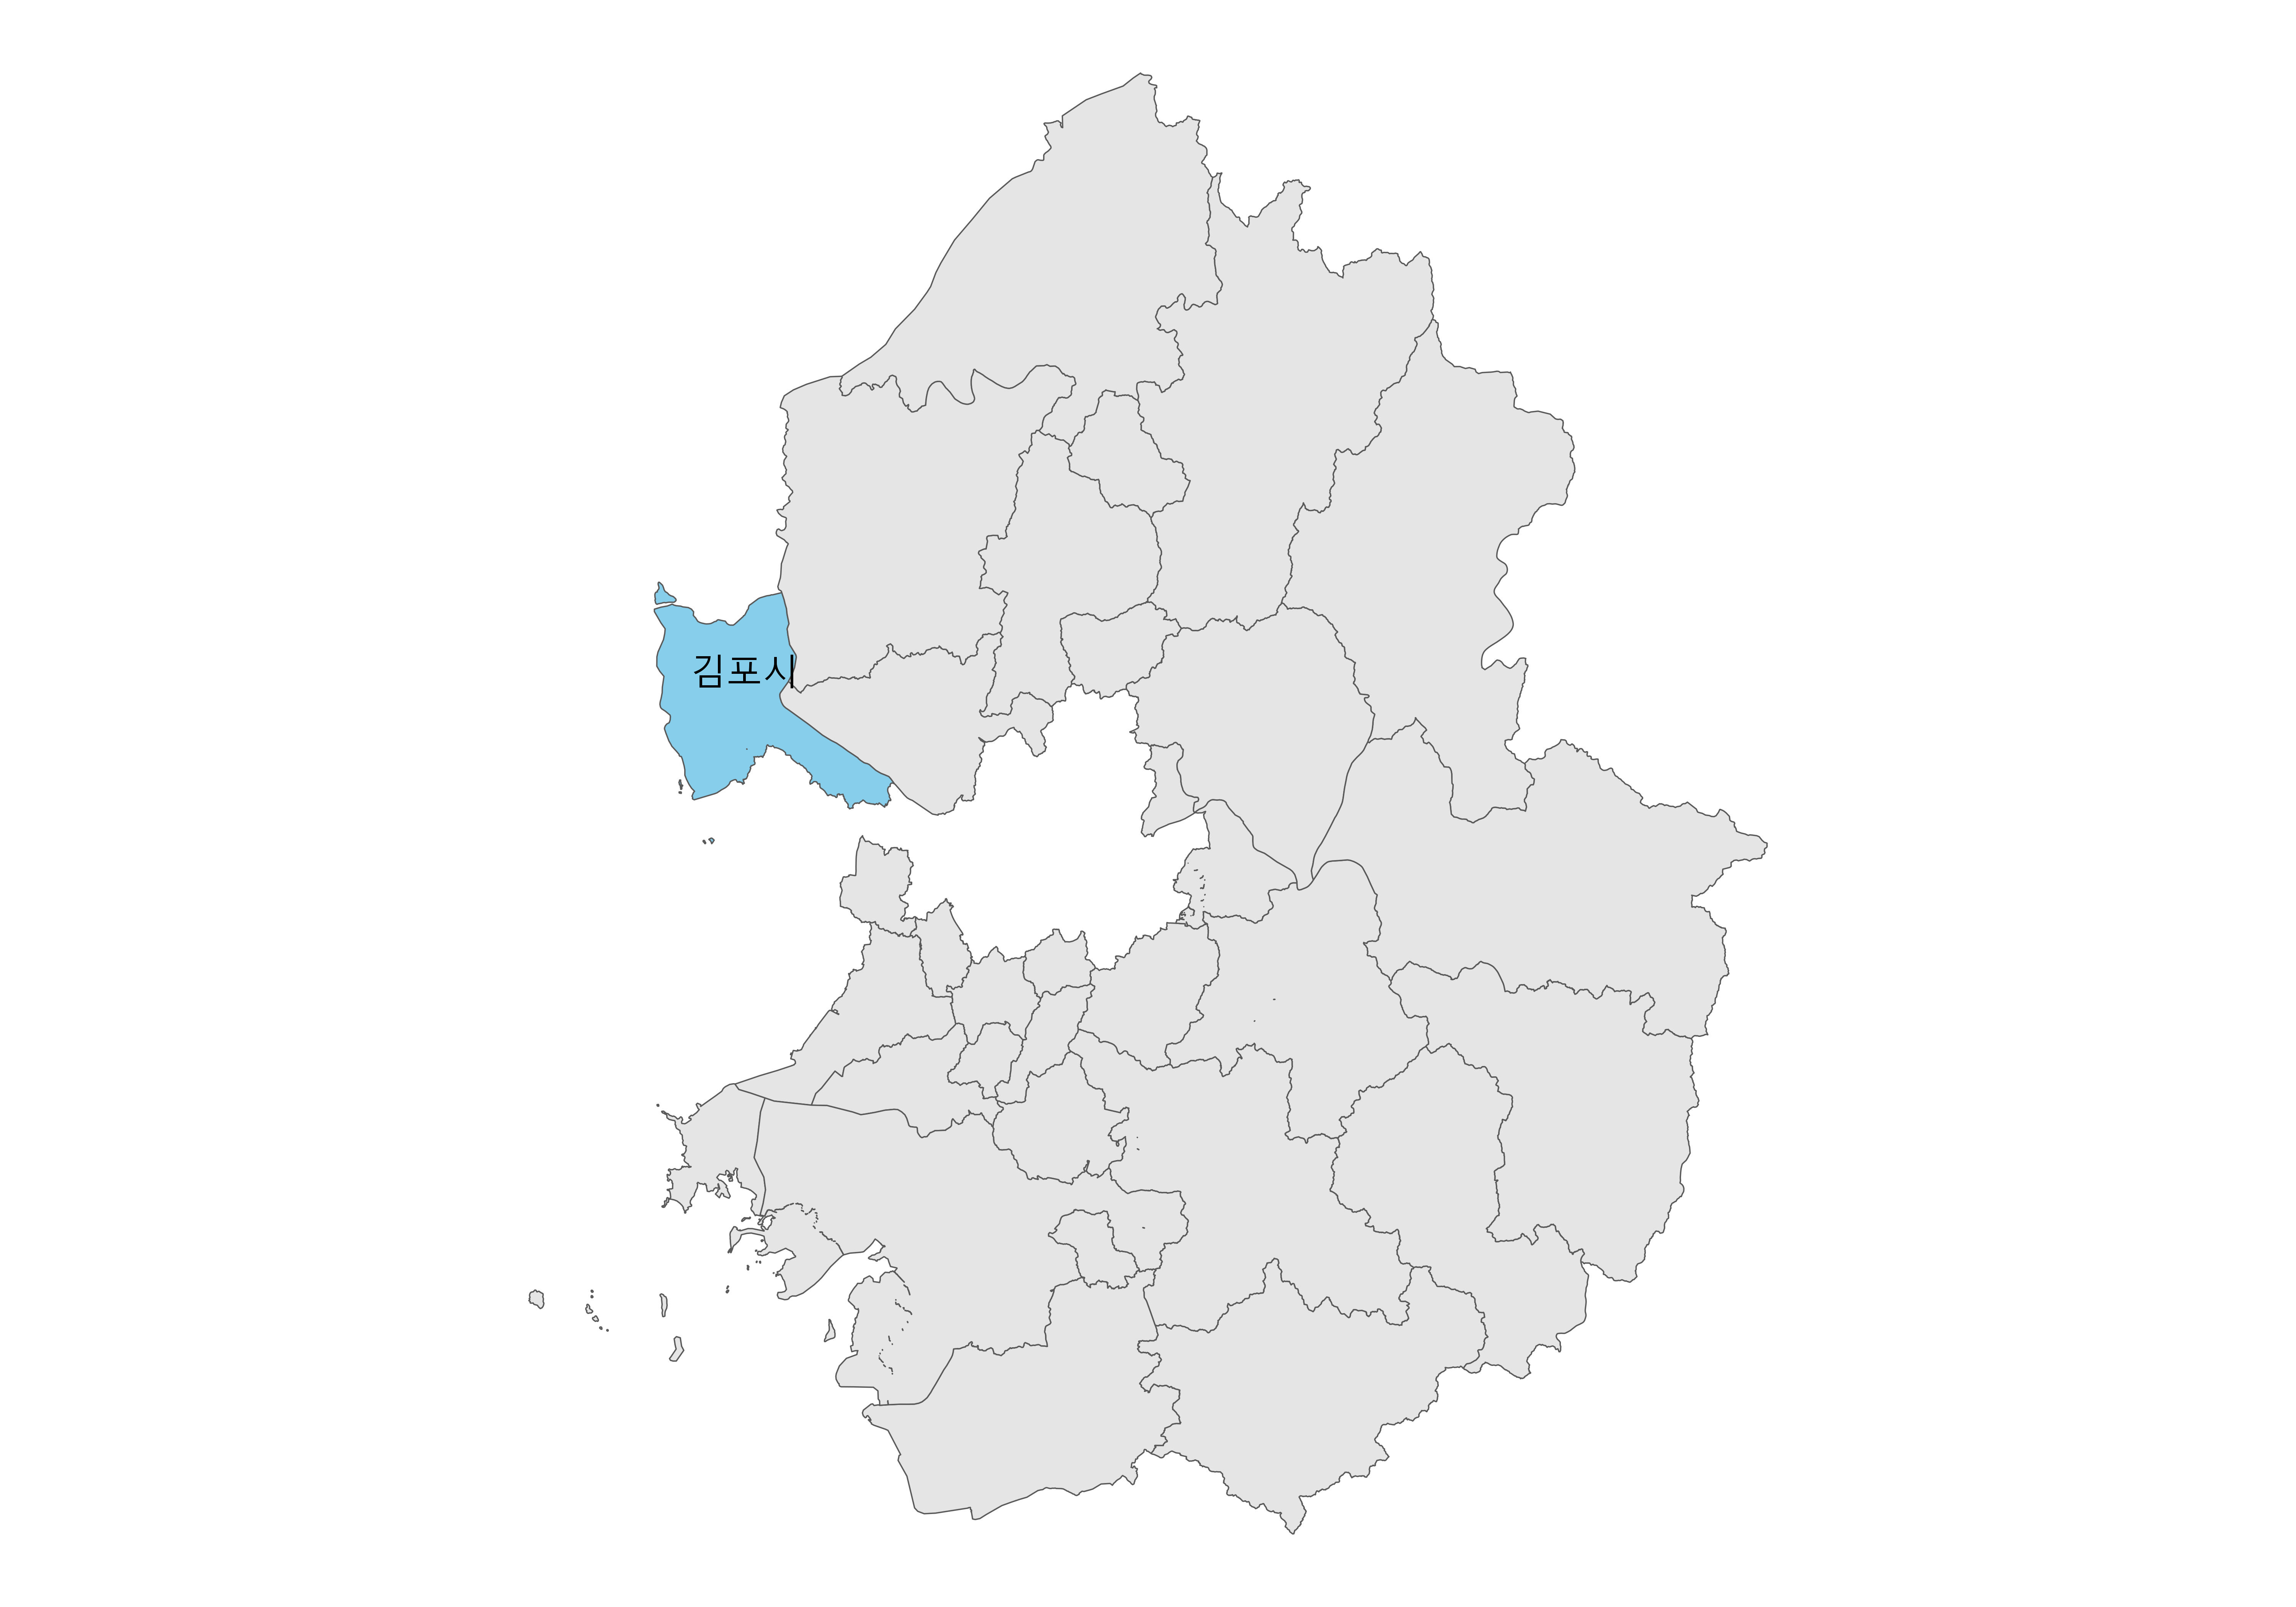
## 김포시
gimpo_adm_sf <- gg_admin_map |> filter(CTY_NM == "김포시")

## 항구
port_tbl <- readxl::read_excel("data/국가어항.xlsx", sheet = "경기어항")

port_sf <- port_tbl |>
  # WGS84
  st_as_sf(coords = c("x", "y"), crs = 4326) |>
  # KATEC
  st_transform(katec_crs)

gg_gimpo_port_gg <- ggplot() +
  geom_sf(data = gimpo_adm_sf) +
  theme_void(base_family = "MaruBuri") +
  scale_fill_manual(values = c("gray90", "skyblue")) +
  ggrepel::geom_text_repel(
    data = gimpo_adm_sf,
      aes(label = ADMI_NM, geometry = geometry), stat = "sf_coordinates",
      min.segment.length = 1, size = 4, max.overlaps = Inf, family = "MaruBrui") +
    theme(legend.position = "none") +
    geom_sf(data=port_sf |> filter(어항명 == "대명항"), size = 3, color = "red", alpha=0.3) +
  ggrepel::geom_text_repel(
    data = port_sf |> filter(어항명 == "대명항"),
      aes(label = 어항명, geometry = geometry), stat = "sf_coordinates",
      min.segment.length = 3, size = 4, max.overlaps = Inf, family = "MaruBrui", color = "blue")

gg_gimpo_port_gg

ragg::agg_jpeg("images/항구_통계/02_경기도_김포시_대명항.jpg",
              width = 10, height = 7, units = "in", res = 600)
gg_gimpo_port_gg
dev.off()
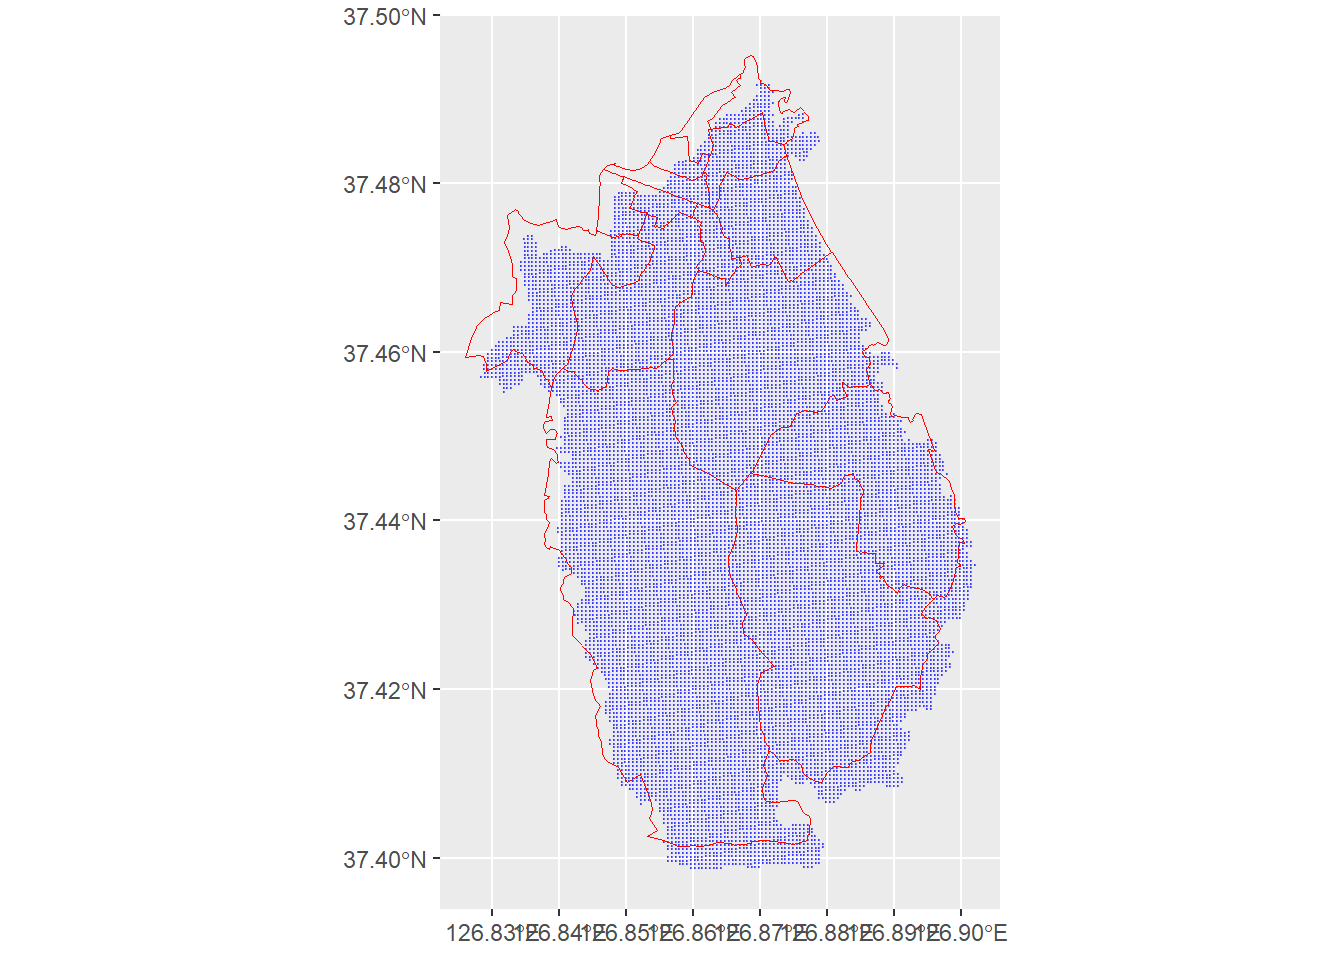
cell_sf <- st_read("data/(공통)셀블록도로행정동/셀(중심점)/cell_gg_admi2_20210616.shp")

gimpo_cty_cell_sf <- st_transform(cell_sf, katec_crs) |>
  filter(CTY_CD == gg_admin_map |> filter(CTY_NM == "김포시") |>
  pull(CTY_CD) |> unique())

## 항구 인근 1 KM
gimpo_ports_cell_sf <- st_join(gimpo_cty_cell_sf,
                               port_sf |> filter(어항명 == "대명항"),
                         maxdist = 1000,
                         join = nngeo::st_nn, left = FALSE)

gimpo_ports_bbox <- st_bbox(gimpo_ports_cell_sf)

### 1. 김포시 Inset

inset_gimpo_gg <- ggplot() +
  ## 1. 행정동 ---------
  geom_sf(data = gimpo_adm_sf) +
  ggrepel::geom_text_repel(
    data = gimpo_adm_sf,
      aes(label = ADMI_NM, geometry = geometry), stat = "sf_coordinates",
      min.segment.length = 1, size = 2, max.overlaps = Inf, family = "MaruBrui") +
    theme(legend.position = "none") +
  ## 2. 항구 ---------
  geom_sf(data=port_sf |> filter(어항명 == "대명항"),
          size = 3, color = "blue", alpha=0.5) +
  theme_void(base_family = "MaruBuri")  +
  geom_rect(aes(xmin = gimpo_ports_bbox['xmin']-1000,
                xmax = gimpo_ports_bbox['xmax']+1000,
                ymin = gimpo_ports_bbox['ymin']-1000,
                ymax = gimpo_ports_bbox['ymax']+1000), fill=NA, color="red")

inset_gimpo_gg

### 2. 김포시 대명항

inset_gimpo_daemyung_gg <- ggplot() +
  geom_sf(data = gimpo_adm_sf) +
  geom_sf(data= gimpo_ports_cell_sf, alpha = 0.1) +
  geom_sf(data=port_sf |> filter(어항명 == "대명항"), size = 3,
          color = "blue", alpha=0.5) +
  ggrepel::geom_text_repel(
    data = port_sf |> filter(어항명 == "대명항"),
      aes(label = 어항명, geometry = geometry), stat = "sf_coordinates",
      min.segment.length = 3, size = 4, max.overlaps = Inf, family = "MaruBrui", color = "blue") +
  theme_void(base_family = "MaruBuri") +
    coord_sf(xlim = c(gimpo_ports_bbox['xmin']-1000,
                      gimpo_ports_bbox['xmax']+1000),
             ylim = c(gimpo_ports_bbox['ymin']-1000,
                      gimpo_ports_bbox['ymax']+1000)) +
  ggspatial::annotation_scale(location = "br", width_hint = 0.5,
                               height = unit(0.3, "cm"))

## 3. 김포시 + 대명항 지도 -------------------------------
daemyung_port_inset_map <- inset_gimpo_daemyung_gg +
  inset_element(inset_gimpo_gg, 0.6, 0.6, 1, 1, align_to = 'full') +
  plot_annotation(title = '김포시 대명항 및 인근 1 KM지역')

daemyung_port_inset_map

fs::dir_create("images/항구_통계/")

ragg::agg_png("images/항구_통계/2_김포_대명항_최종.png",
              width = 10, height = 7, units = "in", res = 600)
daemyung_port_inset_map
dev.off()
library(tidyverse)
library(janitor)
library(gt)
library(gtExtras)
library(sf)
library(patchwork)

katec_crs <- "+proj=tmerc +lat_0=38 +lon_0=128 +k=0.9999 +x_0=400000 +y_0=600000 +ellps=bessel +units=m +no_defs"

gg_admin_map <-
st_read("data/(공통)셀블록도로행정동/행정동경계/행정동경계_경기도/tbshp_admi_gg_20210614.shp")

gg_admin_map <- gg_admin_map |> st_set_crs(katec_crs)

gg_city_map <- gg_admin_map |>
  janitor::clean_names() |>
  group_by(cty_nm) |>
  summarise(geometry = st_union(geometry)) |>
  mutate(cty_target = ifelse(str_detect(cty_nm, "화성"), TRUE, FALSE))

gg_hw_gg <- ggplot() +
  geom_sf(data = gg_city_map, aes(fill = cty_target)) +
  theme_void(base_family = "MaruBuri") +
  scale_fill_manual(values = c("gray90", "skyblue")) +
  ggrepel::geom_text_repel(
      data = gg_city_map |> filter(cty_target == TRUE),
        aes(label = cty_nm, geometry = geometry), stat = "sf_coordinates",
        min.segment.length = 1, size = 4, max.overlaps = Inf,
      family = "MaruBrui") +
  theme(legend.position = "none")

gg_hw_gg

ragg::agg_jpeg("images/항구_통계/02_경기도_화성시.jpg",
              width = 10, height = 7, units = "in", res = 600)
gg_hw_gg
dev.off()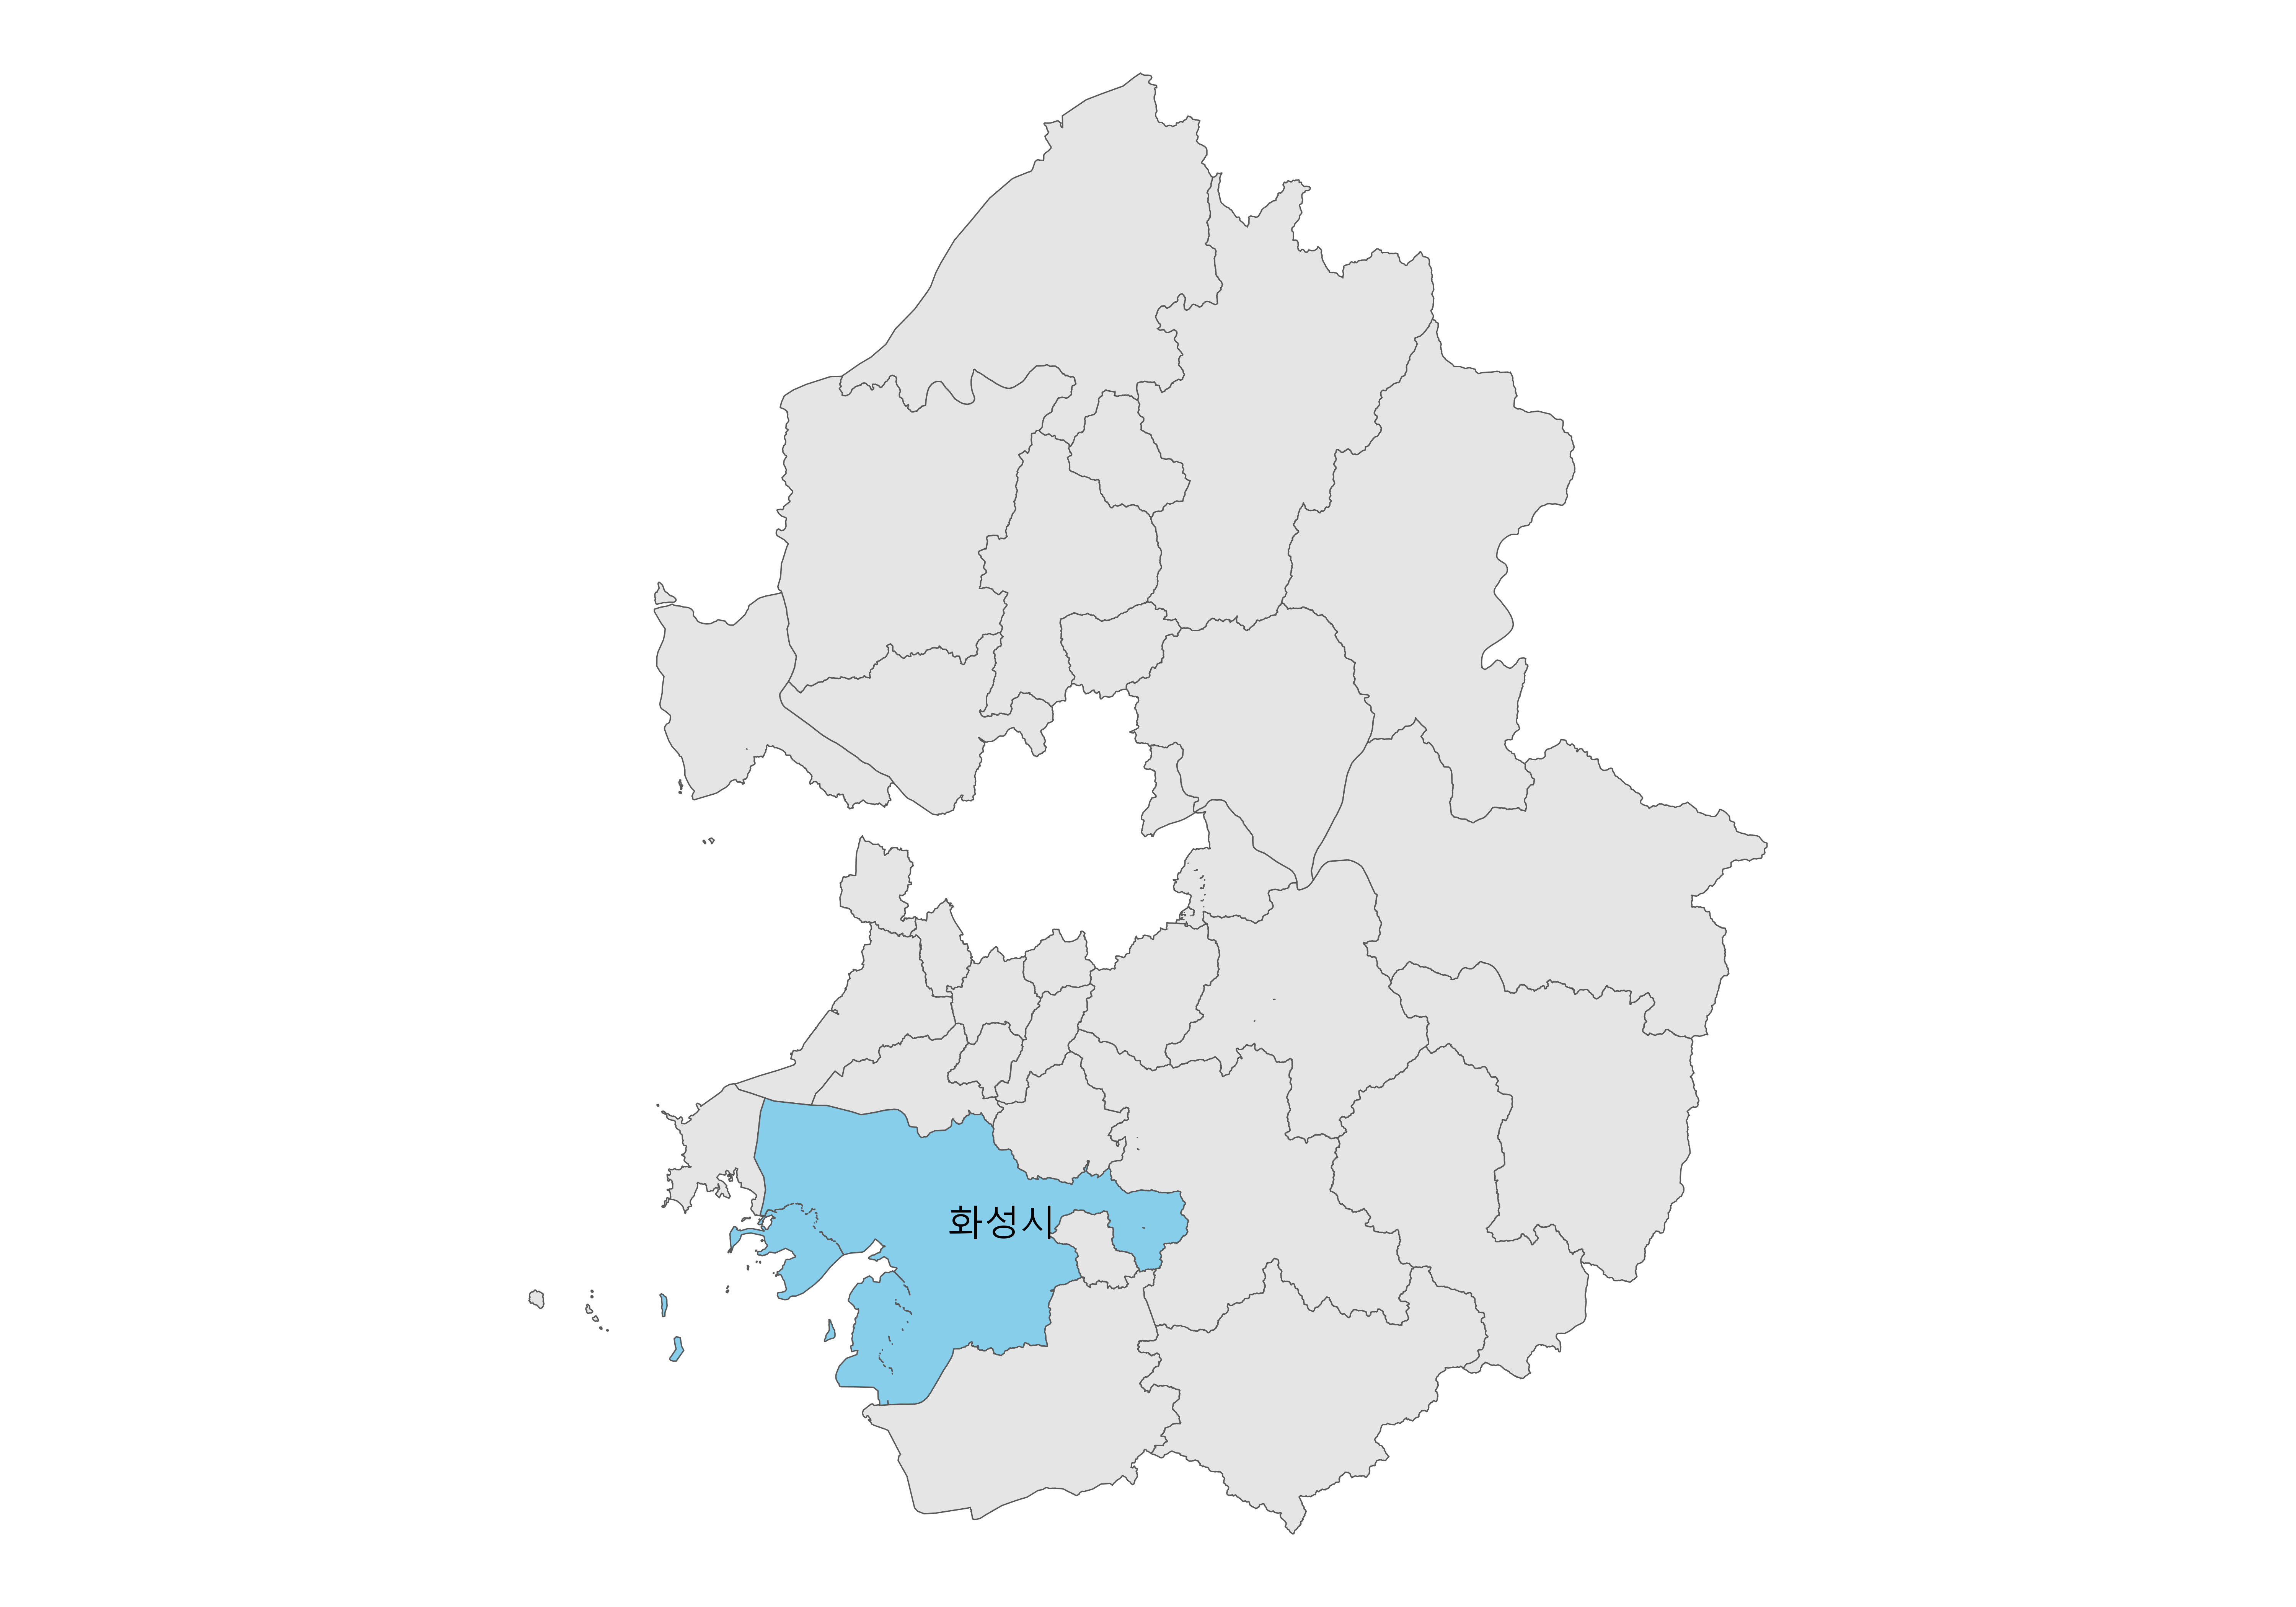
## 김포시
hw_adm_sf <- gg_admin_map |> filter(CTY_NM == "화성시")

## 항구
port_tbl <- readxl::read_excel("data/국가어항.xlsx", sheet = "경기어항")

port_sf <- port_tbl |>
  # WGS84
  st_as_sf(coords = c("x", "y"), crs = 4326) |>
  # KATEC
  st_transform(katec_crs)

gg_hw_port_gg <- ggplot() +
  geom_sf(data = hw_adm_sf) +
  theme_void(base_family = "MaruBuri") +
  scale_fill_manual(values = c("gray90", "skyblue")) +
  ggrepel::geom_text_repel(
    data = hw_adm_sf,
      aes(label = ADMI_NM, geometry = geometry), stat = "sf_coordinates",
      min.segment.length = 1, size = 4, max.overlaps = Inf, family = "MaruBrui") +
    theme(legend.position = "none") +
    geom_sf(data=port_sf |> filter(어항명 == "궁평항"), size = 3, color = "red", alpha=0.3) +
  ggrepel::geom_text_repel(
    data = port_sf |> filter(어항명 == "궁평항"),
      aes(label = 어항명, geometry = geometry), stat = "sf_coordinates",
      min.segment.length = 3, size = 4, max.overlaps = Inf, family = "MaruBrui", color = "blue")

gg_hw_port_gg

ragg::agg_jpeg("images/항구_통계/02_경기도_화성시_궁평항.jpg",
              width = 10, height = 7, units = "in", res = 600)
gg_hw_port_gg
dev.off()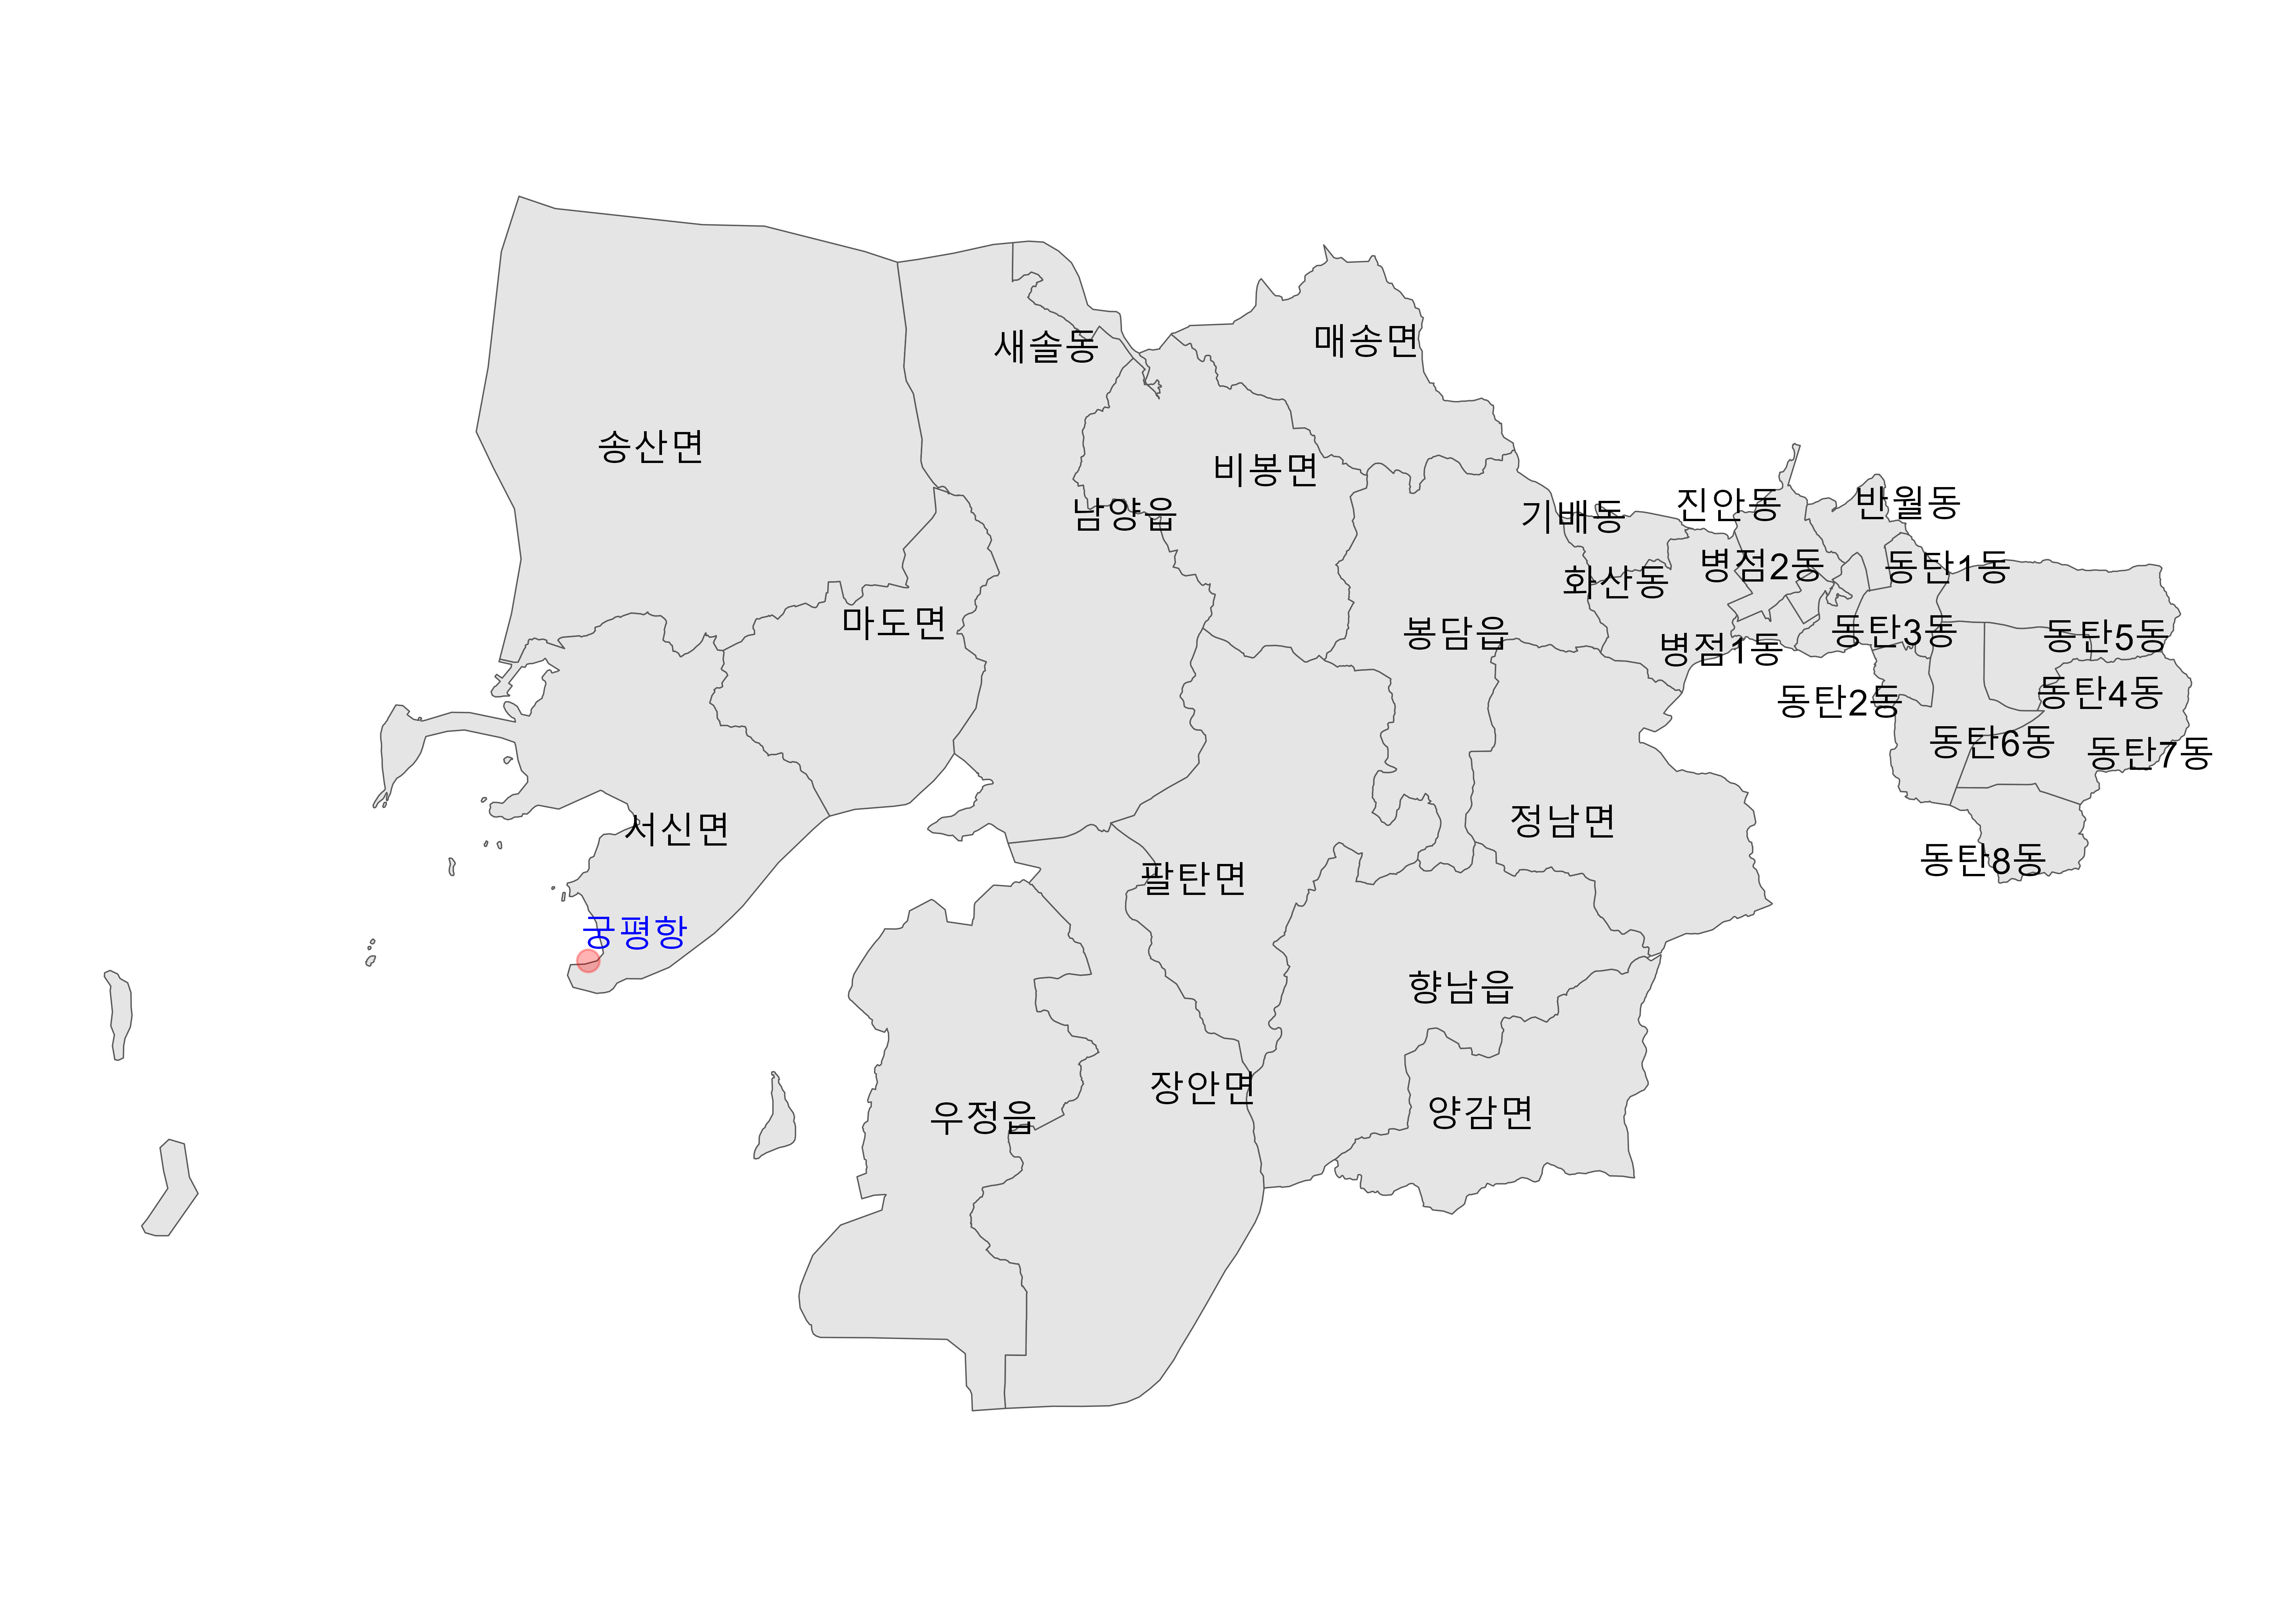
# cell_sf <- st_read("data/(공통)셀블록도로행정동/셀(중심점)/cell_gg_admi2_20210616.shp")

hw_cty_cell_sf <- st_transform(cell_sf, katec_crs) |>
  filter(CTY_CD == gg_admin_map |> filter(CTY_NM == "화성시") |>
  pull(CTY_CD) |> unique())

## 항구 인근 1 KM
hw_ports_cell_sf <- st_join(hw_cty_cell_sf,
                               port_sf |> filter(어항명 == "궁평항"),
                         maxdist = 1000,
                         join = nngeo::st_nn, left = FALSE)

hw_ports_bbox <- st_bbox(hw_ports_cell_sf)

### 1. 화성시 Inset

inset_hw_gg <- ggplot() +
  ## 1. 행정동 ---------
  geom_sf(data = hw_adm_sf) +
  ggrepel::geom_text_repel(
    data = hw_adm_sf,
      aes(label = ADMI_NM, geometry = geometry), stat = "sf_coordinates",
      min.segment.length = 1, size = 2, max.overlaps = Inf, family = "MaruBrui") +
    theme(legend.position = "none") +
  ## 2. 항구 ---------
  geom_sf(data=port_sf |> filter(어항명 == "궁평항"),
          size = 3, color = "blue", alpha=0.5) +
  theme_void(base_family = "MaruBuri")  +
  geom_rect(aes(xmin = hw_ports_bbox['xmin']-1000,
                xmax = hw_ports_bbox['xmax']+1000,
                ymin = hw_ports_bbox['ymin']-1000,
                ymax = hw_ports_bbox['ymax']+1000), fill=NA, color="red")

inset_hw_gg

### 2. 화성시 궁평항

inset_hw_goongpyung_gg <- ggplot() +
  geom_sf(data = hw_adm_sf) +
  geom_sf(data= hw_ports_cell_sf, alpha = 0.1) +
  geom_sf(data=port_sf |> filter(어항명 == "궁평항"), size = 3,
          color = "blue", alpha=0.5) +
  ggrepel::geom_text_repel(
    data = port_sf |> filter(어항명 == "궁평항"),
      aes(label = 어항명, geometry = geometry), stat = "sf_coordinates",
      min.segment.length = 3, size = 4, max.overlaps = Inf, family = "MaruBrui", color = "blue") +
  theme_void(base_family = "MaruBuri") +
    coord_sf(xlim = c(hw_ports_bbox['xmin']-1000,
                      hw_ports_bbox['xmax']+1000),
             ylim = c(hw_ports_bbox['ymin']-1000,
                      hw_ports_bbox['ymax']+1000)) +
  ggspatial::annotation_scale(location = "br", width_hint = 0.5,
                               height = unit(0.3, "cm"))

## 3. 화성시 + 궁평항 지도 -------------------------------
goongpyung_port_inset_map <- inset_hw_goongpyung_gg +
  inset_element(inset_hw_gg, 0.6, 0.6, 1, 1, align_to = 'full') +
  plot_annotation(title = '화성시 궁평항 및 인근 1 KM지역')

goongpyung_port_inset_map

ragg::agg_png("images/항구_통계/2_화성_궁평항_최종.png",
              width = 10, height = 7, units = "in", res = 600)
goongpyung_port_inset_map
dev.off()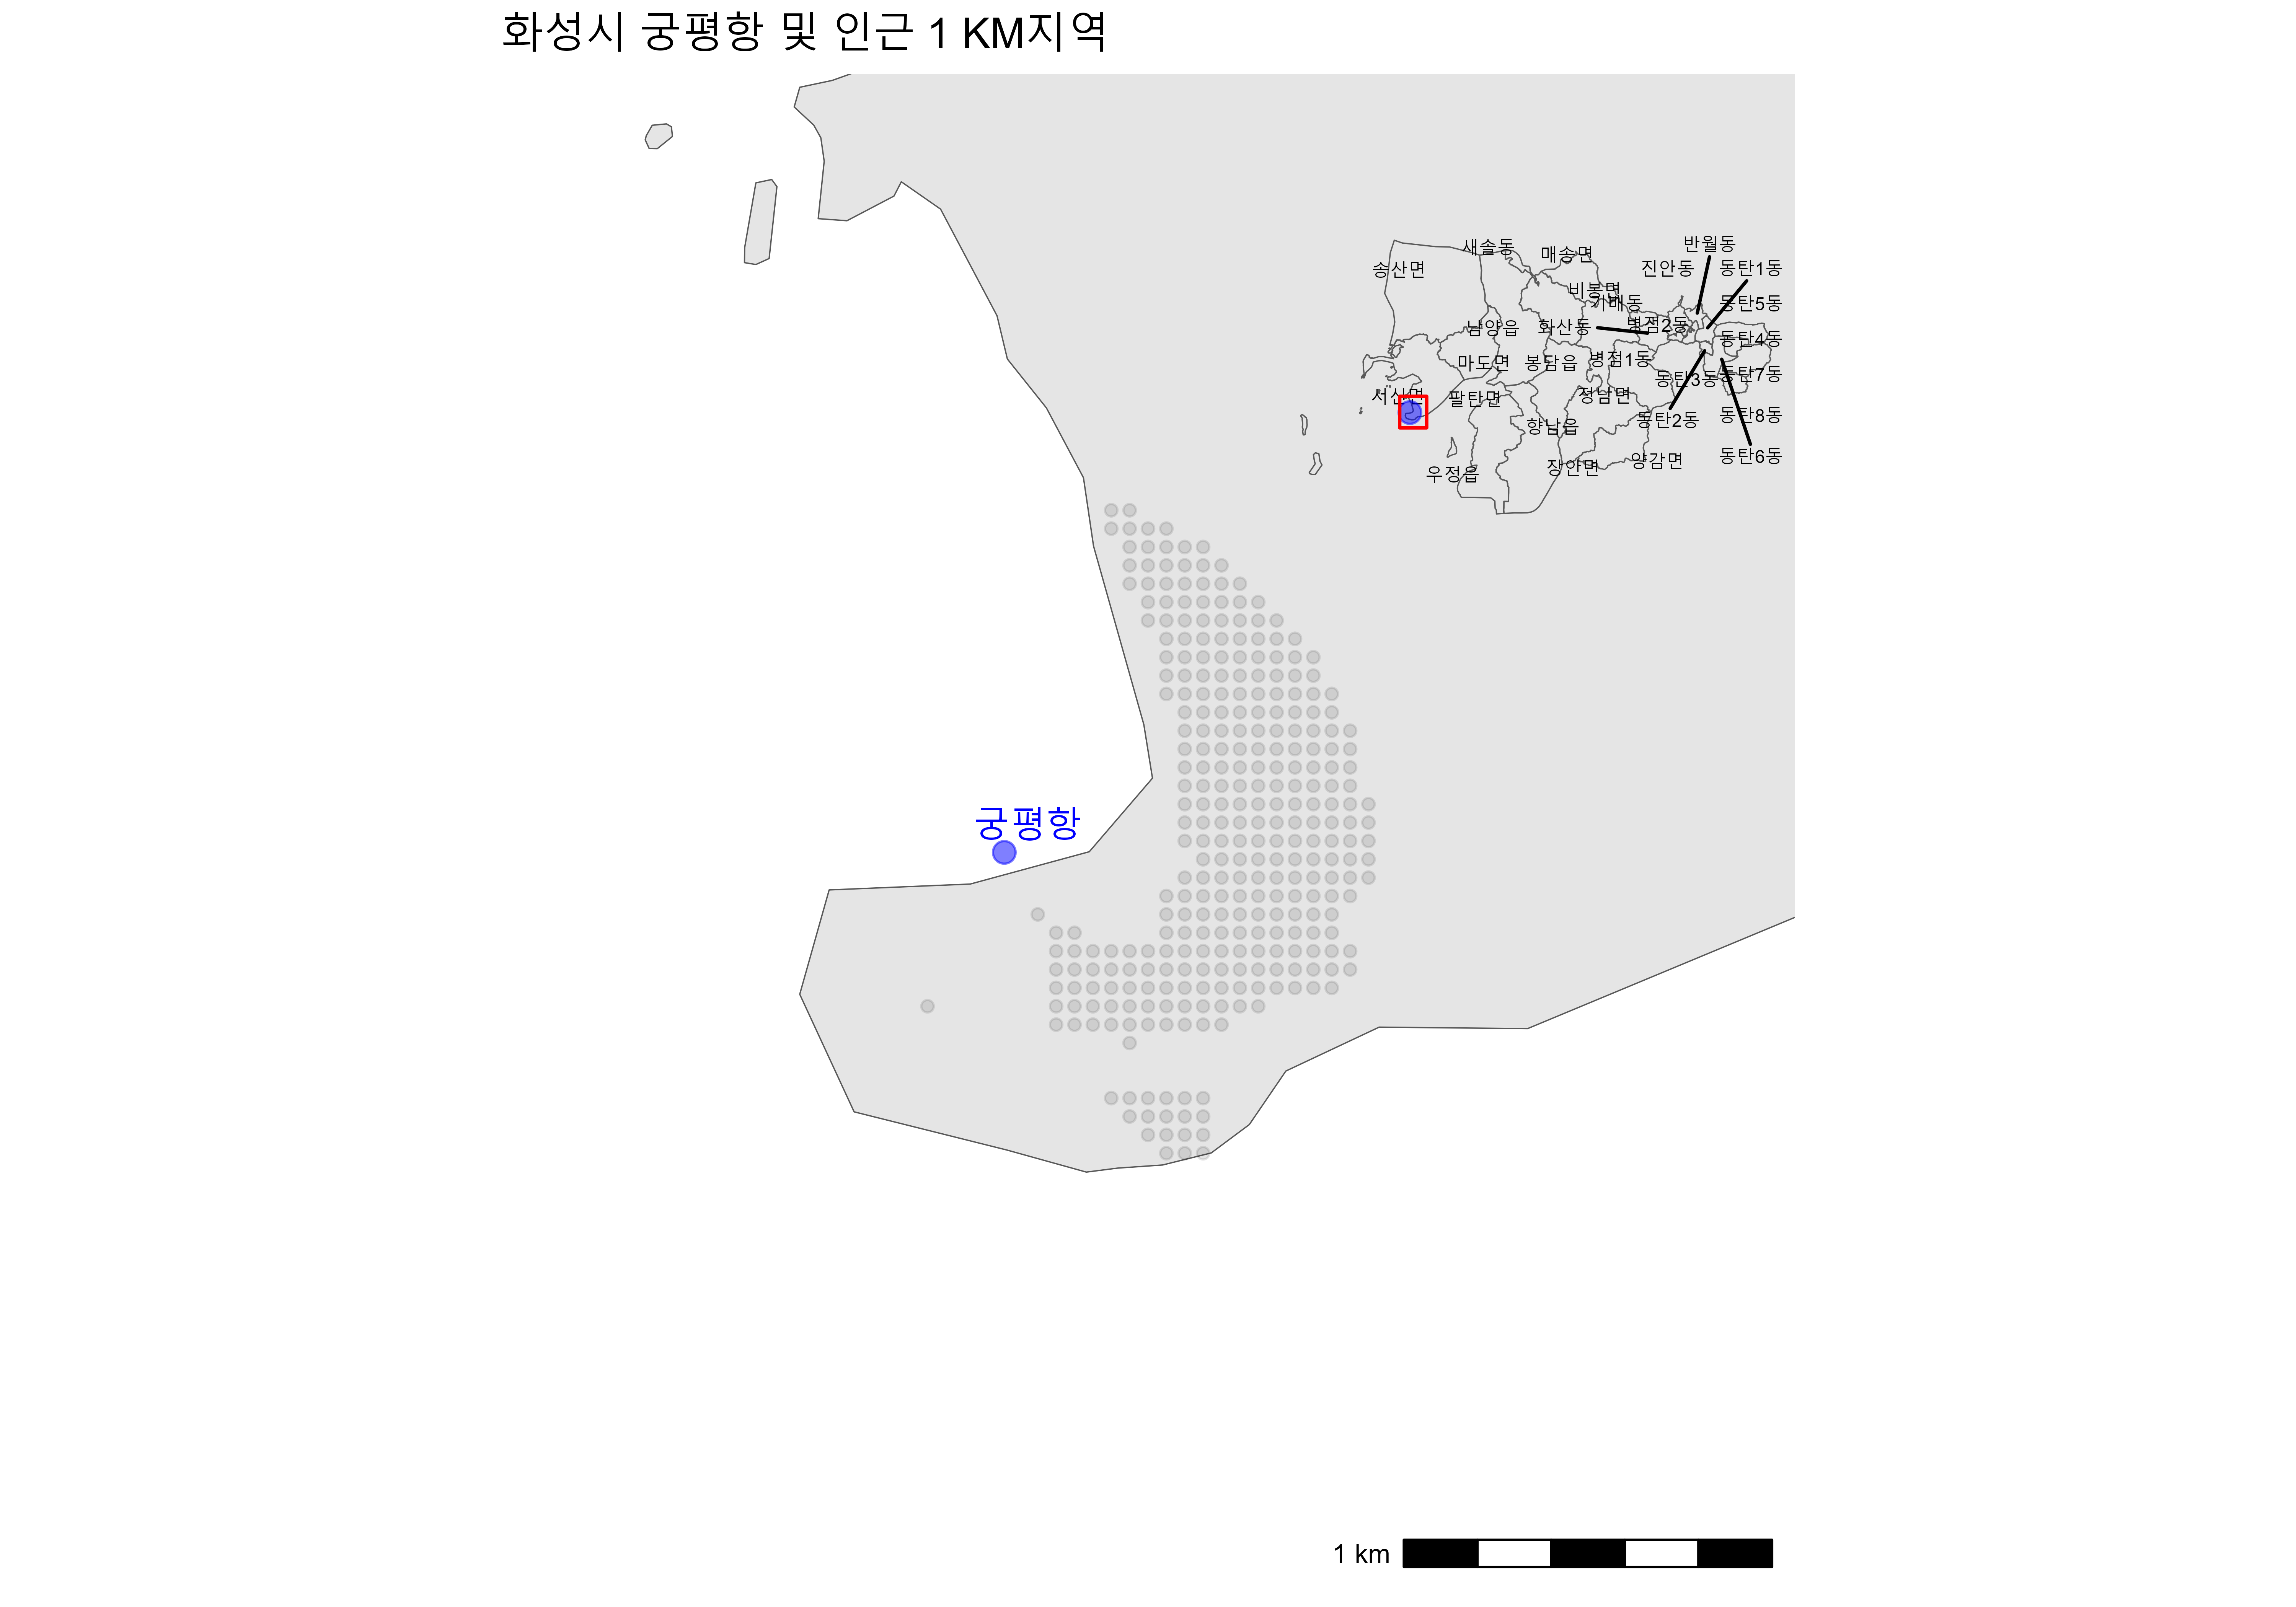
library(tidyverse)
library(janitor)
library(gt)
library(gtExtras)
library(sf)
library(patchwork)

katec_crs <- "+proj=tmerc +lat_0=38 +lon_0=128 +k=0.9999 +x_0=400000 +y_0=600000 +ellps=bessel +units=m +no_defs"

gg_admin_map <-
st_read("data/(공통)셀블록도로행정동/행정동경계/행정동경계_경기도/tbshp_admi_gg_20210614.shp")

gg_admin_map <- gg_admin_map |> st_set_crs(katec_crs)

gg_city_map <- gg_admin_map |>
  janitor::clean_names() |>
  group_by(cty_nm) |>
  summarise(geometry = st_union(geometry)) |>
  mutate(cty_target = ifelse(str_detect(cty_nm, "안산"), TRUE, FALSE))

gg_ansan_gg <- ggplot() +
  geom_sf(data = gg_city_map, aes(fill = cty_target)) +
  theme_void(base_family = "MaruBuri") +
  scale_fill_manual(values = c("gray90", "skyblue")) +
  ggrepel::geom_text_repel(
      data = gg_city_map |> filter(cty_target == TRUE),
        aes(label = cty_nm, geometry = geometry), stat = "sf_coordinates",
        min.segment.length = 1, size = 4, max.overlaps = Inf,
      family = "MaruBrui") +
  theme(legend.position = "none")

gg_ansan_gg

ragg::agg_jpeg("images/항구_통계/02_경기도_안산시.jpg",
              width = 10, height = 7, units = "in", res = 600)
gg_ansan_gg
dev.off()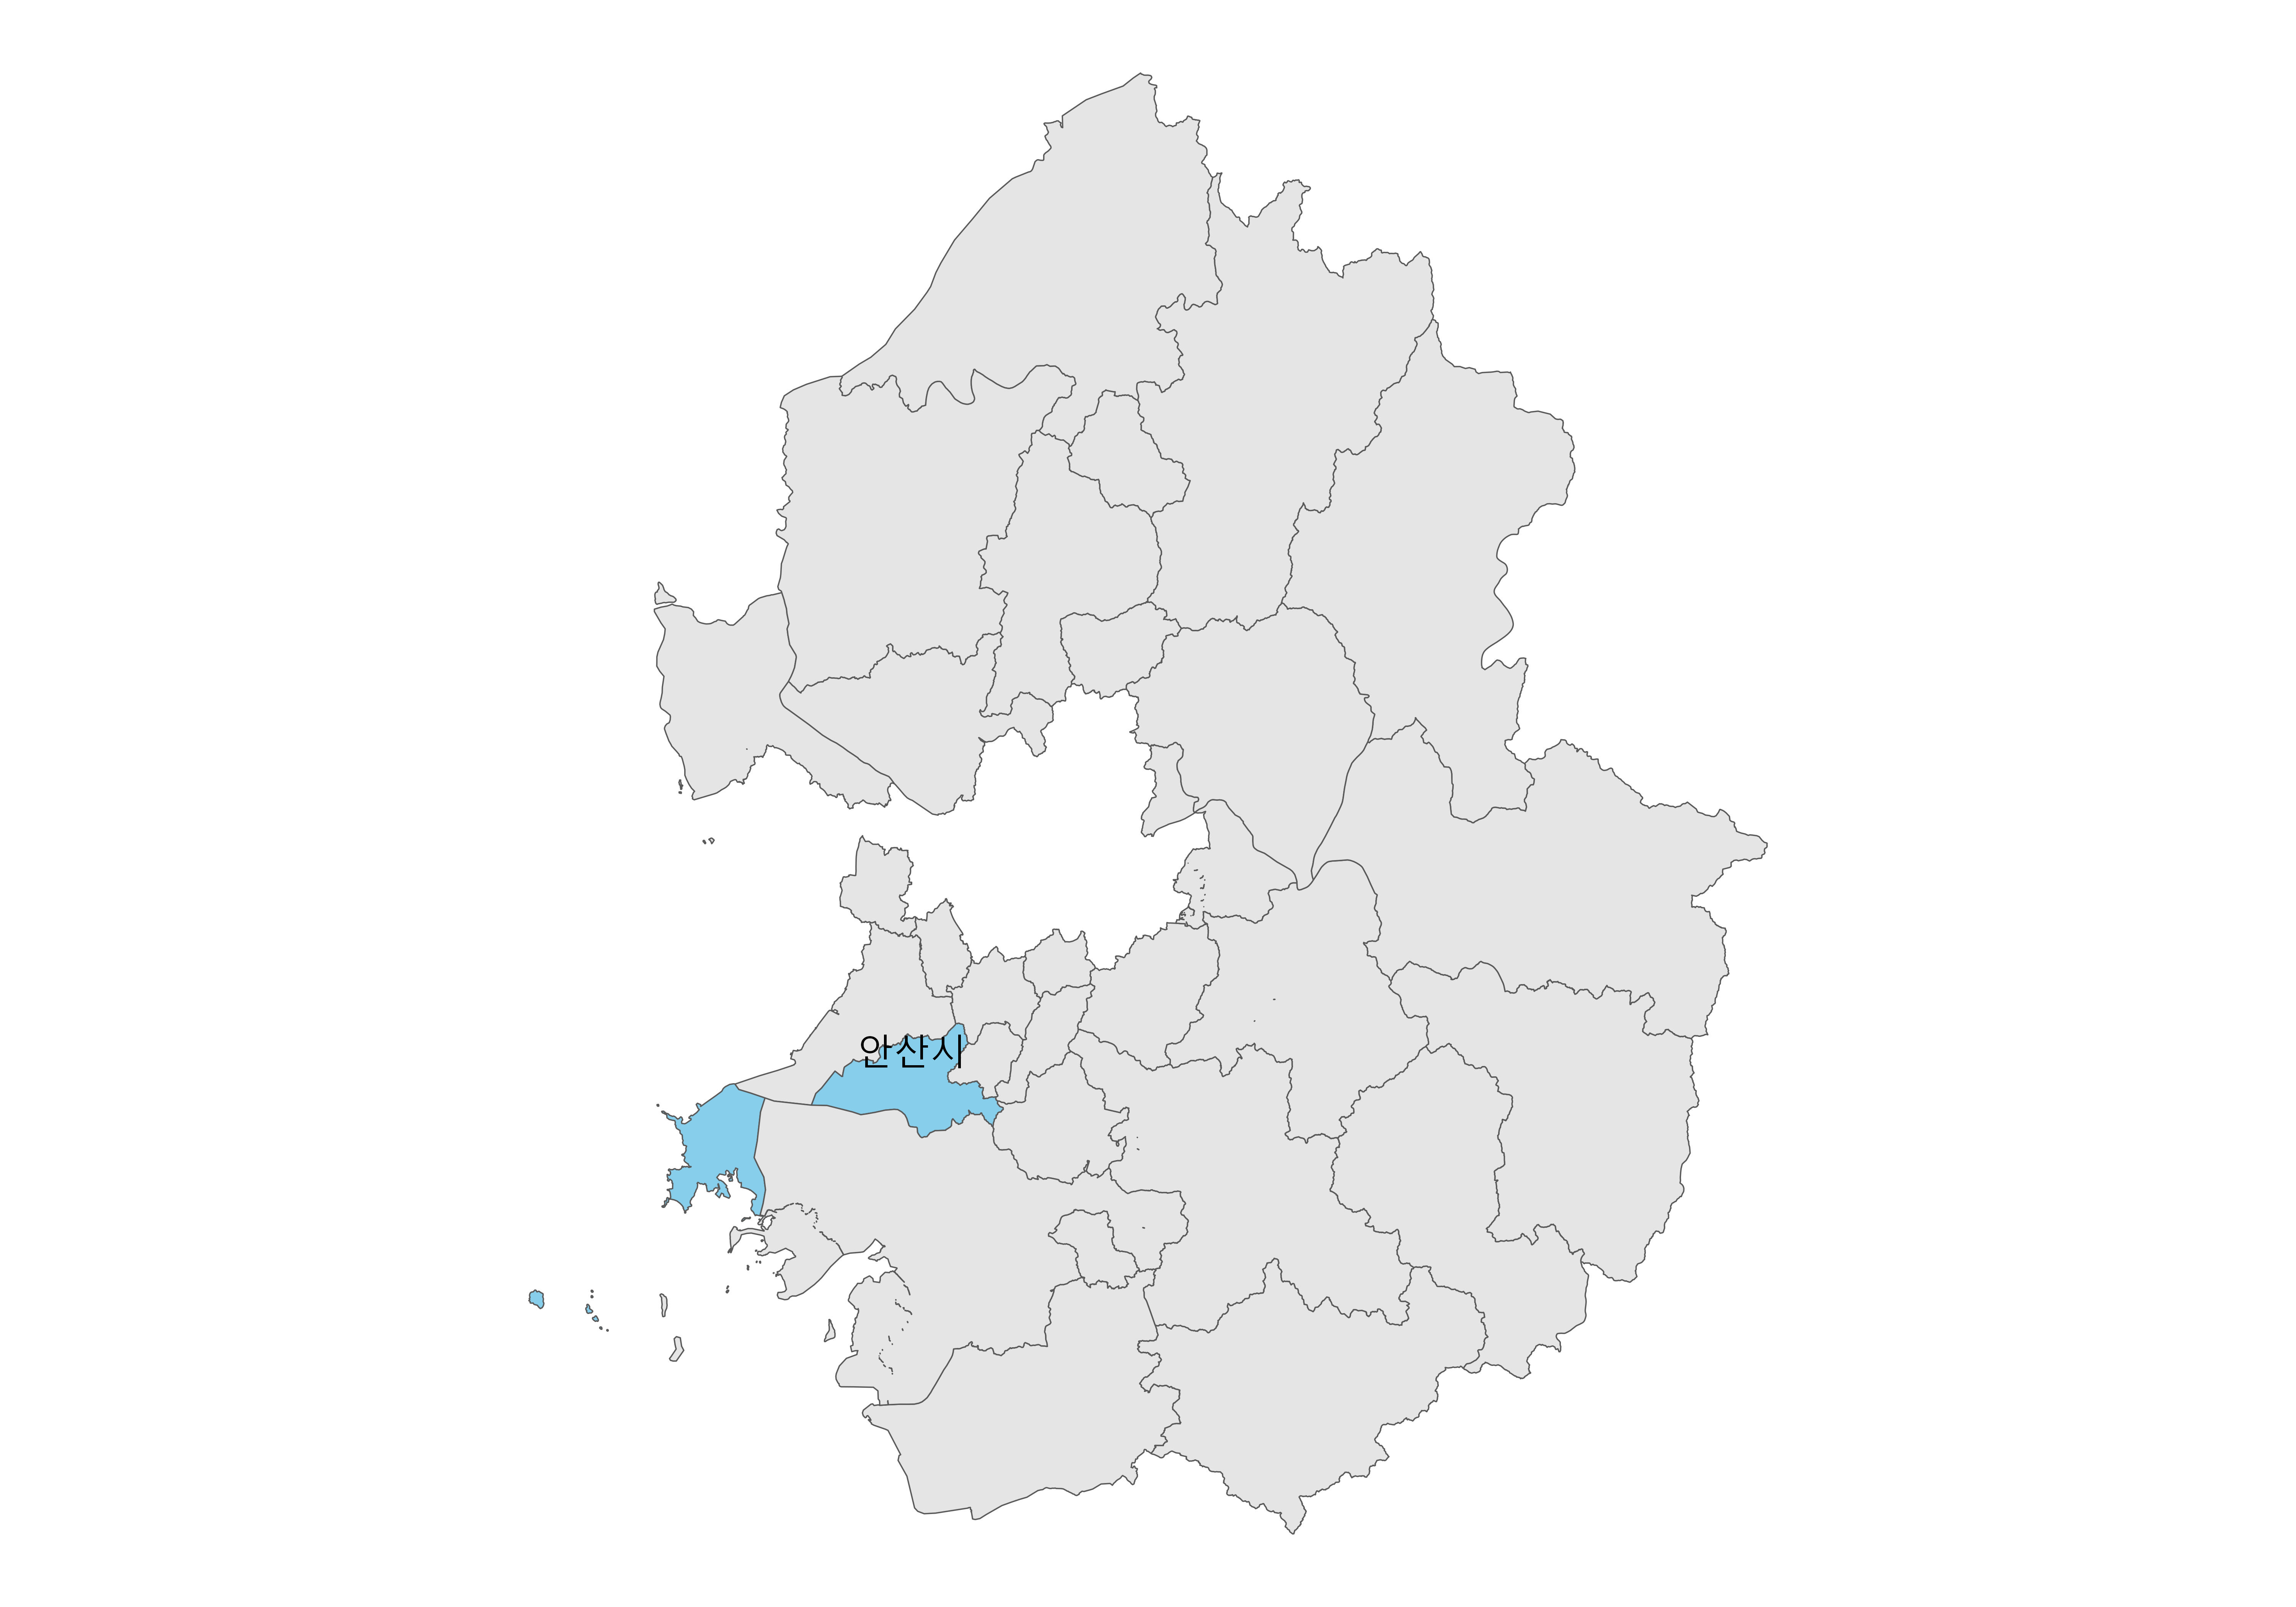
## 안산시
ansan_adm_sf <- gg_admin_map |> filter(CTY_NM == "안산시")

## 항구
port_tbl <- readxl::read_excel("data/국가어항.xlsx", sheet = "경기어항")

port_sf <- port_tbl |>
  # WGS84
  st_as_sf(coords = c("x", "y"), crs = 4326) |>
  # KATEC
  st_transform(katec_crs)

gg_ansan_port_gg <- ggplot() +
  geom_sf(data = ansan_adm_sf) +
  theme_void(base_family = "MaruBuri") +
  scale_fill_manual(values = c("gray90", "skyblue")) +
  ggrepel::geom_text_repel(
    data = ansan_adm_sf,
      aes(label = ADMI_NM, geometry = geometry), stat = "sf_coordinates",
      min.segment.length = 1, size = 4, max.overlaps = Inf, family = "MaruBrui") +
    theme(legend.position = "none") +
    geom_sf(data=port_sf |> filter(어항명 == "탄도항"), size = 3, color = "red", alpha=0.3) +
  ggrepel::geom_text_repel(
    data = port_sf |> filter(어항명 == "탄도항"),
      aes(label = 어항명, geometry = geometry), stat = "sf_coordinates",
      min.segment.length = 3, size = 4, max.overlaps = Inf, family = "MaruBrui", color = "blue")

gg_ansan_port_gg

ragg::agg_jpeg("images/항구_통계/02_경기도_안산시_탄도항.jpg",
              width = 10, height = 7, units = "in", res = 600)
gg_ansan_port_gg
dev.off()
# cell_sf <- st_read("data/(공통)셀블록도로행정동/셀(중심점)/cell_gg_admi2_20210616.shp")

ansan_cty_cell_sf <- st_transform(cell_sf, katec_crs) |>
  filter(CTY_CD == gg_admin_map |> filter(CTY_NM == "안산시") |>
  pull(CTY_CD) |> unique())

## 항구 인근 1 KM
ansan_ports_cell_sf <- st_join(ansan_cty_cell_sf,
                               port_sf |> filter(어항명 == "탄도항"),
                         maxdist = 1000,
                         join = nngeo::st_nn, left = FALSE)

ansan_ports_bbox <- st_bbox(ansan_ports_cell_sf)

### 1. 안산시 Inset

inset_ansan_gg <- ggplot() +
  ## 1. 행정동 ---------
  geom_sf(data = ansan_adm_sf) +
  ggrepel::geom_text_repel(
    data = ansan_adm_sf,
      aes(label = ADMI_NM, geometry = geometry), stat = "sf_coordinates",
      min.segment.length = 1, size = 2, max.overlaps = Inf, family = "MaruBrui") +
    theme(legend.position = "none") +
  ## 2. 항구 ---------
  geom_sf(data=port_sf |> filter(어항명 == "탄도항"),
          size = 3, color = "blue", alpha=0.5) +
  theme_void(base_family = "MaruBuri")  +
  geom_rect(aes(xmin = ansan_ports_bbox['xmin']-1000,
                xmax = ansan_ports_bbox['xmax']+1000,
                ymin = ansan_ports_bbox['ymin']-1000,
                ymax = ansan_ports_bbox['ymax']+1000), fill=NA, color="red") +
    theme(axis.text = element_blank(),
      axis.ticks = element_blank(),
      axis.ticks.length = unit(0, "pt"),
      axis.title=element_blank(),
      plot.margin = margin(0, 0, 0, 0, "cm"),
      panel.background = element_rect(fill = "lightblue"))

inset_ansan_gg

### 2. 안산시 탄도항

inset_ansan_tando_gg <- ggplot() +
  geom_sf(data = ansan_adm_sf) +
  geom_sf(data= ansan_ports_cell_sf, alpha = 0.1) +
  geom_sf(data=port_sf |> filter(어항명 == "탄도항"), size = 3,
          color = "blue", alpha=0.5) +
  ggrepel::geom_text_repel(
    data = port_sf |> filter(어항명 == "탄도항"),
      aes(label = 어항명, geometry = geometry), stat = "sf_coordinates",
      min.segment.length = 3, size = 4, max.overlaps = Inf, family = "MaruBrui", color = "blue") +
  theme_void(base_family = "MaruBuri") +
    coord_sf(xlim = c(ansan_ports_bbox['xmin']-1000,
                      ansan_ports_bbox['xmax']+1000),
             ylim = c(ansan_ports_bbox['ymin']-1000,
                      ansan_ports_bbox['ymax']+1000)) +
  ggspatial::annotation_scale(location = "br", width_hint = 0.5,
                               height = unit(0.3, "cm"))

## 3. 안산시 + 탄도항 지도 -------------------------------
tando_port_inset_map <- inset_ansan_tando_gg +
  inset_element(inset_ansan_gg, 0.5, 0.5, 1, 1, align_to = 'full') +
  plot_annotation(title = '안산시 탄도항 및 인근 1 KM지역')

tando_port_inset_map

ragg::agg_png("images/항구_통계/3_안산_탄도항_최종.png",
              width = 10, height = 7, units = "in", res = 600)
tando_port_inset_map
dev.off()
library(tidyverse)
library(janitor)
library(gt)
library(gtExtras)
library(sf)
library(patchwork)

katec_crs <- "+proj=tmerc +lat_0=38 +lon_0=128 +k=0.9999 +x_0=400000 +y_0=600000 +ellps=bessel +units=m +no_defs"

gg_admin_map <-
st_read("data/(공통)셀블록도로행정동/행정동경계/행정동경계_경기도/tbshp_admi_gg_20210614.shp")

gg_admin_map <- gg_admin_map |> st_set_crs(katec_crs)

gg_city_map <- gg_admin_map |>
  janitor::clean_names() |>
  group_by(cty_nm) |>
  summarise(geometry = st_union(geometry)) |>
  mutate(cty_target = ifelse(str_detect(cty_nm, "김포"), TRUE, FALSE))

gg_gimpo_gg <- ggplot() +
  geom_sf(data = gg_city_map, aes(fill = cty_target)) +
  theme_void(base_family = "MaruBuri") +
  scale_fill_manual(values = c("gray90", "skyblue")) +
  ggrepel::geom_text_repel(
      data = gg_city_map |> filter(cty_target == TRUE),
        aes(label = cty_nm, geometry = geometry), stat = "sf_coordinates",
        min.segment.length = 1, size = 4, max.overlaps = Inf,
      family = "MaruBrui") +
  theme(legend.position = "none")

gg_gimpo_gg

ragg::agg_jpeg("images/항구_통계/02_경기도_김포시.jpg",
              width = 10, height = 7, units = "in", res = 600)
gg_gimpo_gg
dev.off()
## 김포시
gimpo_adm_sf <- gg_admin_map |> filter(CTY_NM == "김포시")

## 항구
port_tbl <- readxl::read_excel("data/국가어항.xlsx", sheet = "경기어항")

port_sf <- port_tbl |>
  # WGS84
  st_as_sf(coords = c("x", "y"), crs = 4326) |>
  # KATEC
  st_transform(katec_crs)

gg_gimpo_port_gg <- ggplot() +
  geom_sf(data = gimpo_adm_sf) +
  theme_void(base_family = "MaruBuri") +
  scale_fill_manual(values = c("gray90", "skyblue")) +
  ggrepel::geom_text_repel(
    data = gimpo_adm_sf,
      aes(label = ADMI_NM, geometry = geometry), stat = "sf_coordinates",
      min.segment.length = 1, size = 4, max.overlaps = Inf, family = "MaruBrui") +
    theme(legend.position = "none") +
    geom_sf(data=port_sf |> filter(어항명 == "대명항"), size = 3, color = "red", alpha=0.3) +
  ggrepel::geom_text_repel(
    data = port_sf |> filter(어항명 == "대명항"),
      aes(label = 어항명, geometry = geometry), stat = "sf_coordinates",
      min.segment.length = 3, size = 4, max.overlaps = Inf, family = "MaruBrui", color = "blue")

gg_gimpo_port_gg

ragg::agg_jpeg("images/항구_통계/02_경기도_김포시_대명항.jpg",
              width = 10, height = 7, units = "in", res = 600)
gg_gimpo_port_gg
dev.off()
cell_sf <- st_read("data/(공통)셀블록도로행정동/셀(중심점)/cell_gg_admi2_20210616.shp")

gimpo_cty_cell_sf <- st_transform(cell_sf, katec_crs) |>
  filter(CTY_CD == gg_admin_map |> filter(CTY_NM == "김포시") |>
  pull(CTY_CD) |> unique())

## 항구 인근 1 KM
gimpo_ports_cell_sf <- st_join(gimpo_cty_cell_sf,
                               port_sf |> filter(어항명 == "대명항"),
                         maxdist = 1000,
                         join = nngeo::st_nn, left = FALSE)

gimpo_ports_cell_sf |>
  write_rds("data/gimpo_ports_cell_sf.rds")

gimpo_ports_bbox <- st_bbox(gimpo_ports_cell_sf)

### 1. 김포시 Inset

inset_gimpo_gg <- ggplot() +
  ## 1. 행정동 ---------
  geom_sf(data = gimpo_adm_sf) +
  ggrepel::geom_text_repel(
    data = gimpo_adm_sf,
      aes(label = ADMI_NM, geometry = geometry), stat = "sf_coordinates",
      min.segment.length = 1, size = 2, max.overlaps = Inf, family = "MaruBrui") +
    theme(legend.position = "none") +
  ## 2. 항구 ---------
  geom_sf(data=port_sf |> filter(어항명 == "대명항"),
          size = 3, color = "blue", alpha=0.5) +
  theme_void(base_family = "MaruBuri")  +
  geom_rect(aes(xmin = gimpo_ports_bbox['xmin']-1000,
                xmax = gimpo_ports_bbox['xmax']+1000,
                ymin = gimpo_ports_bbox['ymin']-1000,
                ymax = gimpo_ports_bbox['ymax']+1000), fill=NA, color="red")

inset_gimpo_gg

### 2. 김포시 대명항

inset_gimpo_daemyung_gg <- ggplot() +
  geom_sf(data = gimpo_adm_sf) +
  geom_sf(data= gimpo_ports_cell_sf, alpha = 0.1) +
  geom_sf(data=port_sf |> filter(어항명 == "대명항"), size = 3,
          color = "blue", alpha=0.5) +
  ggrepel::geom_text_repel(
    data = port_sf |> filter(어항명 == "대명항"),
      aes(label = 어항명, geometry = geometry), stat = "sf_coordinates",
      min.segment.length = 3, size = 4, max.overlaps = Inf, family = "MaruBrui", color = "blue") +
  theme_void(base_family = "MaruBuri") +
    coord_sf(xlim = c(gimpo_ports_bbox['xmin']-1000,
                      gimpo_ports_bbox['xmax']+1000),
             ylim = c(gimpo_ports_bbox['ymin']-1000,
                      gimpo_ports_bbox['ymax']+1000)) +
  ggspatial::annotation_scale(location = "br", width_hint = 0.5,
                               height = unit(0.3, "cm"))

## 3. 김포시 + 대명항 지도 -------------------------------
daemyung_port_inset_map <- inset_gimpo_daemyung_gg +
  inset_element(inset_gimpo_gg, 0.6, 0.6, 1, 1, align_to = 'full') +
  plot_annotation(title = '김포시 대명항 및 인근 1 KM지역')

daemyung_port_inset_map

fs::dir_create("images/항구_통계/")

ragg::agg_png("images/항구_통계/2_김포_대명항_최종.png",
              width = 10, height = 7, units = "in", res = 600)
daemyung_port_inset_map
dev.off()
## 1. 대상파일
kt_cell_files_raw <- fs::dir_ls("data/KT유동인구데이터/셀단위/sex_age/")

kt_cell_files_raw <- kt_cell_files_raw[str_detect(kt_cell_files_raw, "sex_age_\\d{6}")]

## 2. 함수

point_map <- st_read("data/sgg_cell_point/광명시.geojson")

get_sex_age <- function(yearmon="data/KT유동인구데이터/셀단위/sex_age/sex_age_201801.csv") {

  cat("\n ------------------\n", yearmon, "\n")

  sex_age_raw <- read_csv(yearmon)

  km_sex_age <- sex_age_raw %>%
      ## 광명시만 추출
    filter(cell_id %in% unique(point_map$cell_id)) %>%
    ## 자료구조 변환
    pivot_longer(cols = M00_09:F60_up, names_to = "name", values_to = "인구수") %>%
    mutate(성별 = str_sub(name, 1,1),
           연령대 = str_sub(name, 2, 6)) %>%
    ## 자료형 변환
    mutate(연령대 = factor(연령대, levels = c("00_09", "10_19", "20_29", "30_39", "40_49", "50_59", "60_up")),
           성별 = factor(성별, levels = c("M", "F"), labels = c("남성", "여성"))) %>%
    select(-name)

  return(km_sex_age)
}

get_sex_age()

## 3. 김포시 데이터

kt_cell_files <- kt_cell_files_raw %>%
  enframe() %>%
  ## 2018~2022년만 추출
  mutate(년월 = str_sub(str_extract(name, "\\d+"), 1, 4)) %>%
  filter(!년월 %in% c("2017")) %>%
  ## 2018~2022년만 추출
  mutate(년월 = str_sub(str_extract(name, "\\d+"), 1, 6)) %>%
  mutate(년월 = lubridate::ym(년월))

age_sex_yearmon <- kt_cell_files  %>%
  mutate(data = map(name, get_sex_age))

age_sex_yearmon |>
write_rds("data/gimpo_age_sex_2018_2022.rds")gimpo_ports_cell_sf <-
read_rds("data/gimpo_ports_cell_sf.rds")
port_cell_id <- gimpo_ports_cell_sf |>
pull(cell_id) |>
unique()
age_sex_yearmon <-
read_rds("data/gimpo_age_sex_2018_2022.rds")
age_sex_yearmon_tbl <- age_sex_yearmon |>
select(년월, data) |>
unnest(data)
port_age_sex_tbl <- age_sex_yearmon_tbl |>
filter(cell_id %in% port_cell_id)
port_age_sex_tbl |>
write_rds("data/port_age_sex_tbl.rds")extrafont::loadfonts()
port_age_sex_tbl <-
read_rds("data/port_age_sex_tbl.rds")
port_kt_sex_gg <- port_age_sex_tbl |>
group_by(년월, 성별) |>
summarise(유동인구 = sum(인구수) / 10^4) |>
ggplot(aes(x = 년월, y = 유동인구, color = 성별)) +
geom_line() +
geom_point() +
theme_minimal(base_family = "MaruBrui") +
labs(title = "김포시 대명항 인근 1 KM 유동인구",
subtitle = "성별, 2018년 1월 ~ 2022년 12월",
caption = "자료출처: 경기도 분석센터 KT 유동인구",
x = "",
y = "유동인구 (만명)") +
theme(legend.position = "top") +
scale_color_manual(values = c("blue", "black"))
port_kt_sex_gg
ragg::agg_jpeg("images/항구_통계/김포_대명항_유동인구_성별.jpg",
width = 10, height = 7, units = "in", res = 600)
port_kt_sex_gg
dev.off()
port_kt_age_gg <- port_age_sex_tbl |>
  group_by(년월,연령대) |>
  summarise(유동인구 = sum(인구수) / 10^4) |>
  ungroup() |>
  ggplot(aes(x = 년월, y = 유동인구, color = 연령대)) +
    geom_line() +
    geom_point() +
    theme_minimal(base_family = "MaruBrui") +
    labs(title = "김포시 대명항 인근 1 KM 유동인구",
         subtitle = "연령별, 2018년 1월 ~ 2022년 12월",
         caption = "자료출처: 경기도 분석센터 KT 유동인구",
         x = "",
         y = "유동인구 (만명)") +
    theme(legend.position = "top") +
    guides(colour = guide_legend(nrow = 1))

port_kt_age_gg

ragg::agg_jpeg("images/항구_통계/김포_대명항_유동인구_연령별.jpg",
              width = 10, height = 7, units = "in", res = 600)
port_kt_age_gg
dev.off()
## 1. 대상파일

amt_files <- fs::dir_ls("data/BC카드데이터/TBSH_GYEONGGI_SELNG/")

amt_raw <- amt_files %>%
  enframe() %>%
  mutate(data = map(value, read_delim)) %>%
  select(name, data) %>%
  mutate(name = str_extract(name, "\\d+\\.txt$")) %>%
  unnest(data)

amt_tbl <- amt_raw %>%
  janitor::clean_names() %>%
mutate(ta_ym = lubridate::ym(ta_ym))cell_blk_raw <- read_delim("data/(공통)셀블록도로행정동/셀_블록_행정동/kt_cell_v6_20210528.csv")
port_cell_blk_raw <- cell_blk_raw |>
janitor::clean_names() |>
rename(cell_id = id) |>
filter(cell_id %in% port_cell_id)
port_cell_blk_cd <- port_cell_blk_raw |>
pull(blk_cd) |> unique()bc_yearmon_gg <- port_amt_tbl |>
group_by(ta_ym) |>
summarise(결재건수 = sum(total_cnt)/ 10^4,
결재금액 = sum(total_amt)/ 10^8,) |>
ggplot(aes(x = ta_ym, y = 결재금액)) +
geom_line() +
geom_point() +
theme_light(base_family = "MaruBrui") +
labs(title = "김포시 대명항 인근 1 KM 결재금액",
subtitle = "연령별, 2018년 1월 ~ 2022년 12월",
caption = "자료출처: 경기도 분석센터 KT 유동인구",
x = "",
y = "결재금액(억원)") +
theme(legend.position = "top") +
guides(colour = guide_legend(nrow = 1))
bc_yearmon_gg
ragg::agg_jpeg("images/항구_통계/김포_대명항_결재금액.jpg",
width = 10, height = 7, units = "in", res = 600)
bc_yearmon_gg
dev.off()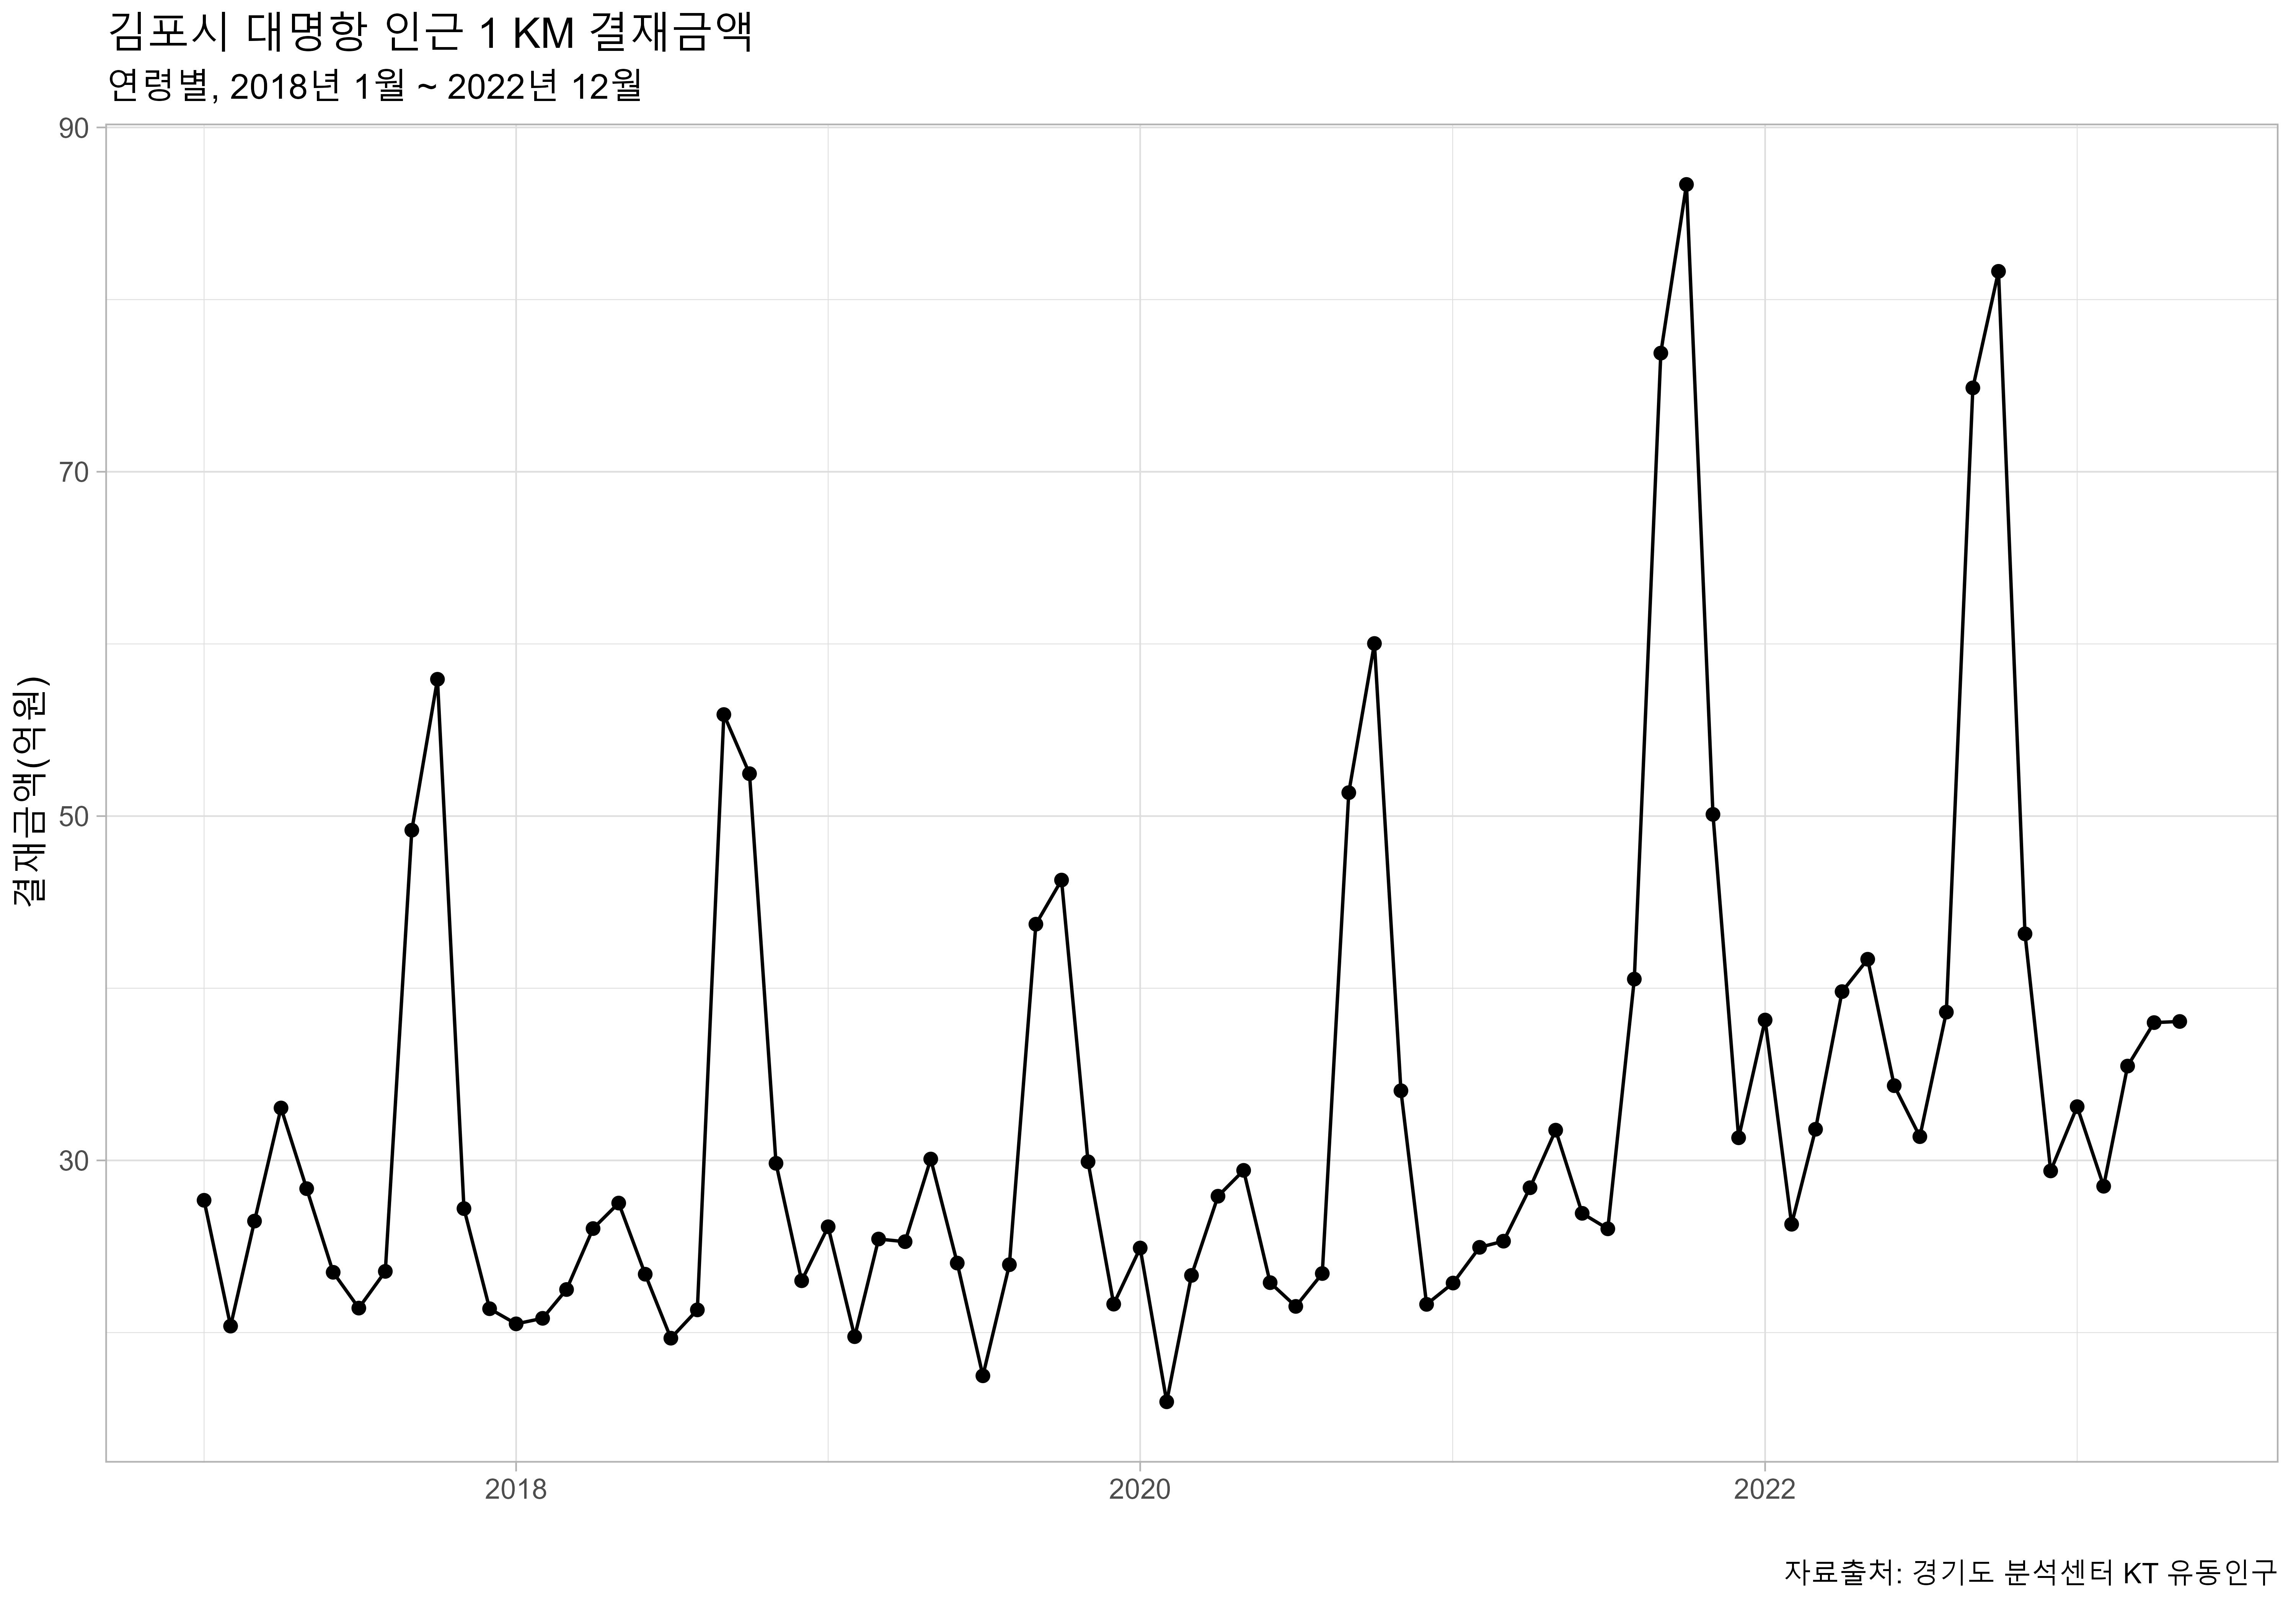
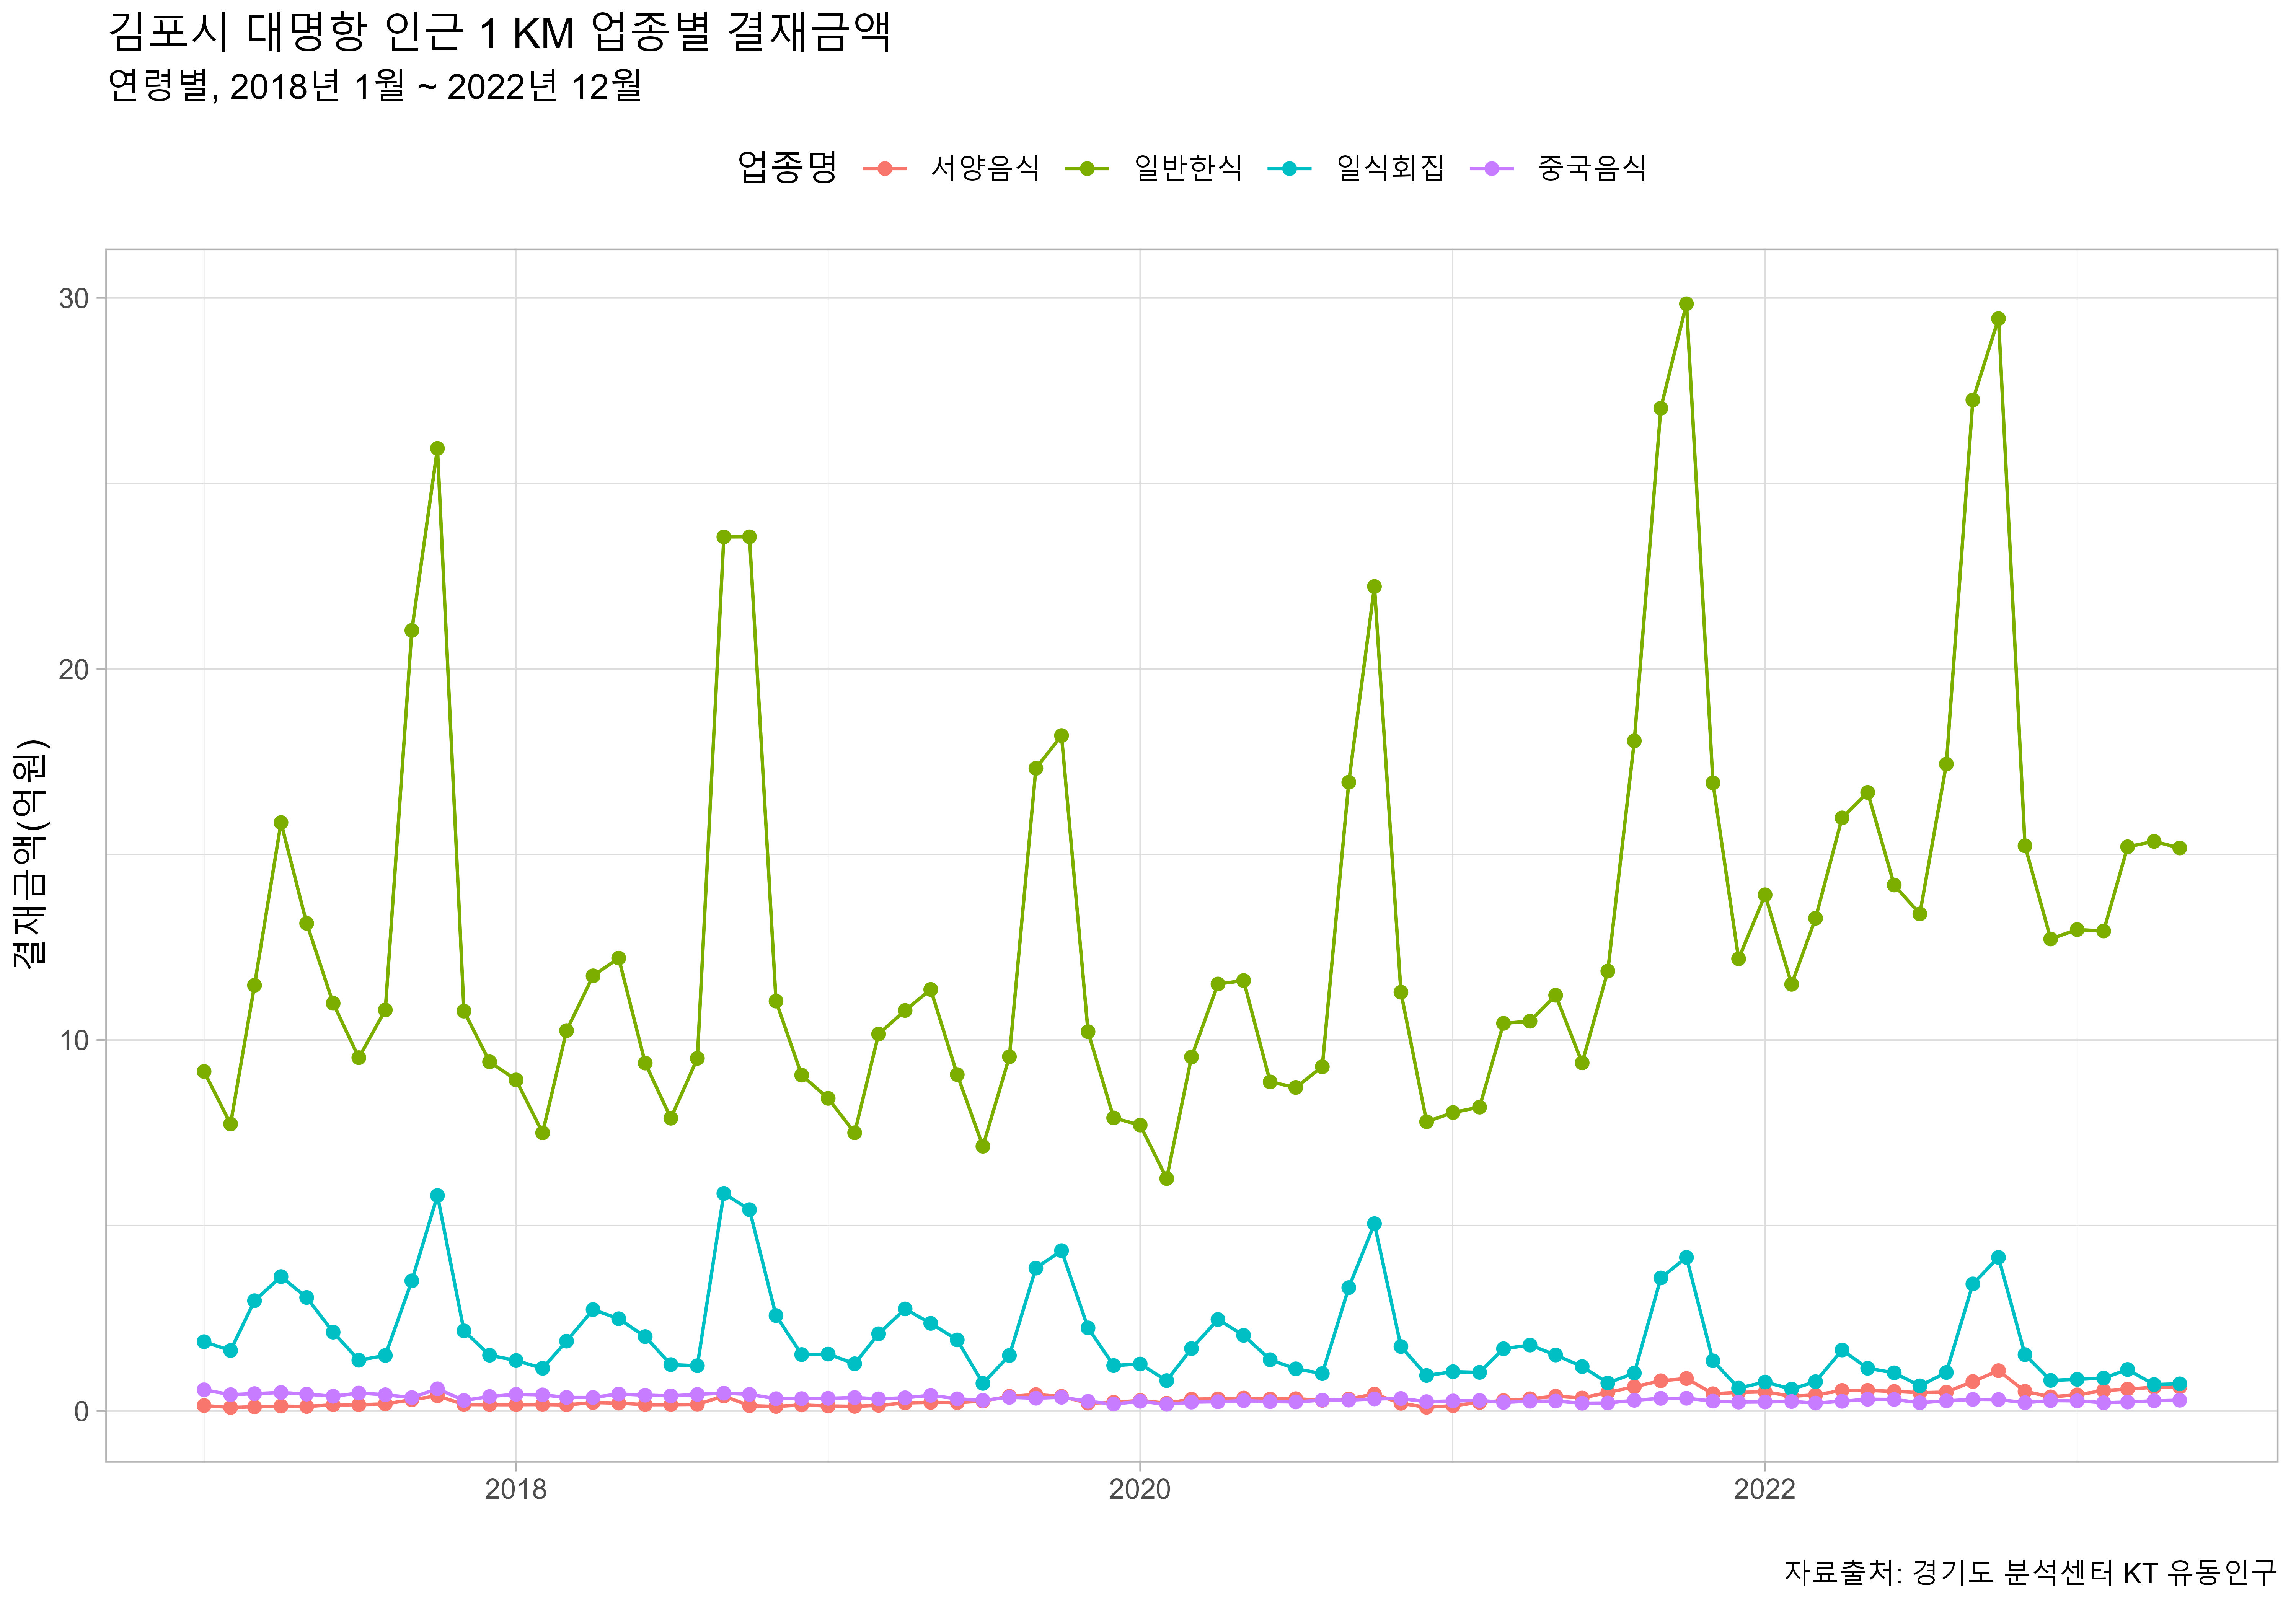
code_table <- tribble(~"mer_buz_code", ~"업종명",
8001,   "일반한식",
8002,   "갈비전문점",
8003,   "한정식",
8004,   "일식회집",
8005,   "중국음식",
8006,   "서양음식")


bc_type_yearmon_gg <- port_amt_tbl |>
  filter(mer_buz_code %in% c(8001, 8004, 8005, 8006)) |>
  left_join(code_table) |>
  group_by(ta_ym, 업종명) |>
  summarise(결재건수 = sum(total_cnt)/ 10^4,
            결재금액 = sum(total_amt)/ 10^8,) |>
  ungroup() |>
  ggplot(aes(x = ta_ym, y = 결재금액, color = 업종명)) +
    geom_line() +
    geom_point() +
    theme_light(base_family = "MaruBrui") +
    labs(title = "김포시 대명항 인근 1 KM 업종별 결재금액",
         subtitle = "연령별, 2018년 1월 ~ 2022년 12월",
         caption = "자료출처: 경기도 분석센터 KT 유동인구",
         x = "",
         y = "결재금액(억원)") +
    theme(legend.position = "top") +
    guides(colour = guide_legend(nrow = 1))

bc_type_yearmon_gg

ragg::agg_jpeg("images/항구_통계/김포_대명항_음식점_결재금액.jpg",
              width = 10, height = 7, units = "in", res = 600)
bc_type_yearmon_gg
dev.off()