---
title: "지도제작 대회"
subtitle: "지도 색칠"
description: |
지도를 색칠해보자.
author:
- name: 이광춘
url: https://www.linkedin.com/in/kwangchunlee/
affiliation: 한국 R 사용자회
affiliation-url: https://github.com/bit2r
title-block-banner: true
format:
html:
theme: flatly
code-fold: true
code-overflow: wrap
toc: true
toc-depth: 3
toc-title: 목차
number-sections: true
highlight-style: github
self-contained: false
default-image-extension: jpg
filters:
- lightbox
lightbox: auto
bibliography: bibliography.bib
link-citations: true
csl: apa-single-spaced.csl
knitr:
opts_chunk:
message: false
warning: false
collapse: true
comment: "#>"
R.options:
knitr.graphics.auto_pdf: true
editor_options:
chunk_output_type: console
---
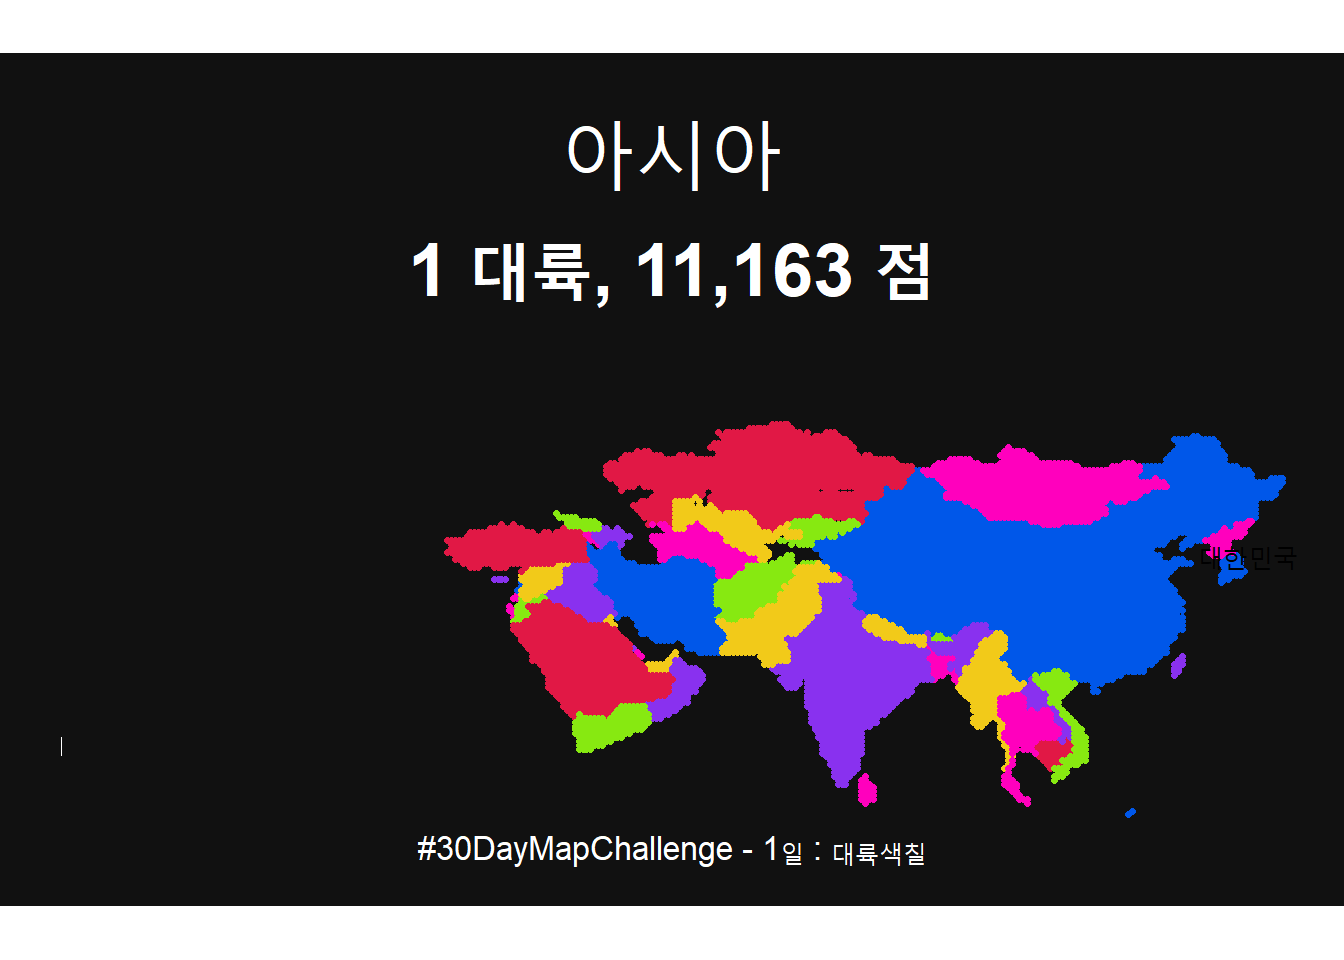
# 아시아 대륙 색칠
```{r}
# Libraries Loading -------------------------------------------------------
library(tidyverse)
library(sf)
library(ggtext)
library(maps)
extrafont::loadfonts("win")


# Data Reading and Wrangling ----------------------------------------------
# Generating pixel grid
lat <- tibble(lat = seq(-90, 90, by = .5))
long <- tibble(long = seq(-180, 180, by = .5))

dots <- lat %>%
  full_join(long, by = character()) %>%
  as_tibble()

dots <- dots %>%
  mutate(country = map.where('world', long, lat),
         lakes = map.where('lakes', long, lat)) %>%
  filter(!is.na(country) & is.na(lakes)) %>%
  dplyr::select(-lakes)

world <- rnaturalearth::ne_countries(scale = "medium", returnclass = "sf") %>%
  filter(region_wb != "Antarctica")

dots <- dots %>%
  mutate(
    country = case_when(
      country %in% c("Comoros:Grande Comore", "Comoros:Anjouan") ~ "Comoros",
      country %in% c("Cape Verde:Santo Antao","Cape Verde:Sao Tiago") ~ "Cape Verde",
      country == "Guinea-Bissau" ~ "Guinea Bissau",
      country == "Equatorial Guinea:Rio Muni" ~ "Equatorial Guinea",
      country ==  "Malawi:3" ~ "Malawi",
      country == "Somalia:Somaliland" ~ "Somaliland",
      country == "Tanzania" ~ "United Republic of Tanzania",
      TRUE ~ country))

asia_dots <- world %>%
  filter(continent == "Asia") %>%
  dplyr::select(admin, mapcolor7) %>%
  left_join(dots, by = c("admin" = "country"))

# Graphic -----------------------------------------------------------------
palette <- c("#8931EF", "#F2CA19", "#FF00BD" , "#0057E9", "#87E911", "#E11845", "#FF8A12")

# 2021 Version ----
asia_dots %>%
  ggplot() +
  geom_point(aes(x = long, y = lat, color = factor(mapcolor7)), size = .95) +
  guides(color ="none") +
  scale_color_manual(
    values = palette
  ) +
  labs(
    title = "아시아",
    subtitle = glue::glue("1 대륙, {scales::comma(nrow(asia_dots))} 점"),
    caption = "#30DayMapChallenge - 1일 : 대륙색칠"
  ) +
  annotate(geom = "text", x = 130, y = 38, label = "대한민국", size = 4, family = "MaruBuri") +
  annotate(geom = "segment", x = -23.5, y = 12, xend = -23.5, yend = 14.5, size = .125, color = "white") +
  coord_fixed(clip = "off") +
  theme_void(base_family = "MaruBuri") +
  theme(
    plot.background = element_rect(fill = "#111111",color = NA),
    plot.title = element_text(hjust = .5, size = rel(3), color = "white", family = "MaruBuri", margin = margin(t = 25,b = 15)),
    plot.subtitle = element_text(hjust = .5, size = rel(2.5), color = "white",family = "MaruBuri", face = "bold", margin = margin(b = 35)),
    plot.caption = element_text(size = rel(1.125), hjust = .5, color = "white", family = "MaruBuri", margin = margin(b = 15))
  )
```
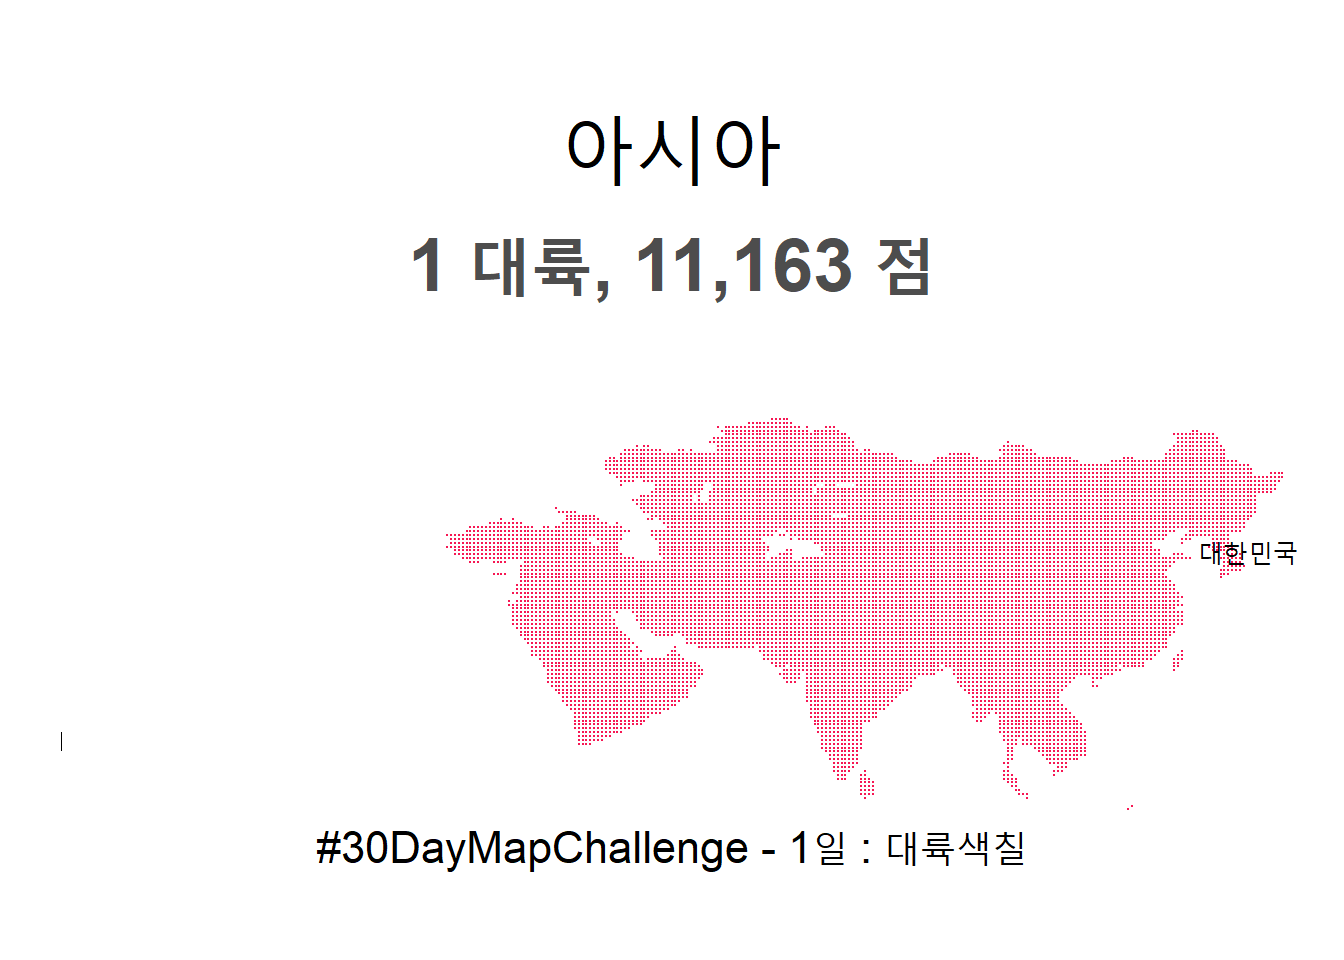
# 아시아 대륙 점
```{r}
# 2022 Version ----
asia_dots %>%
  ggplot() +
  geom_point(aes(x = long, y = lat), color = "#F61753", size = .05) +
  labs(
    title = "아시아",
    subtitle = glue::glue("1 대륙, {scales::comma(nrow(asia_dots))} 점"),
    caption = "#30DayMapChallenge - 1일 : 대륙색칠"
  ) +
  annotate(geom = "text", x = 130, y = 38, label = "대한민국", size = 4, family = "MaruBuri") +
  annotate(geom = "segment", x = -23.5, y = 12, xend = -23.5, yend = 14.5, size = .125) +
  coord_fixed(clip = "off") +
  theme_void(base_family = "MaruBuri") +
  theme(
    plot.background = element_rect(fill = "#FFFFFF",color = NA),
    plot.title = element_text(hjust = .5, size = rel(3),  family = "MaruBuri", margin = margin(t = 25,b = 15)),
    plot.subtitle = element_text(hjust = .5, color ="grey30", size = rel(2.5), family = "MaruBuri", face = "bold", margin = margin(b = 35)),
    plot.caption = element_text(size = rel(1.5), hjust = .5, family = "MaruBuri", margin = margin(b = 15))
  )
```