bill_mat <- matrix( bill_df$total_bill,
nrow = 2,
byrow=TRUE,
dimnames = list(c("여성", "남성"), c("점심", "저녁"))
)
mf_col <- c("#3CC3BD", "#FD8210")
barplot(bill_mat, beside = TRUE, border=NA, col=mf_col)
legend("topleft", row.names(bill_mat), pch=15, col=mf_col)
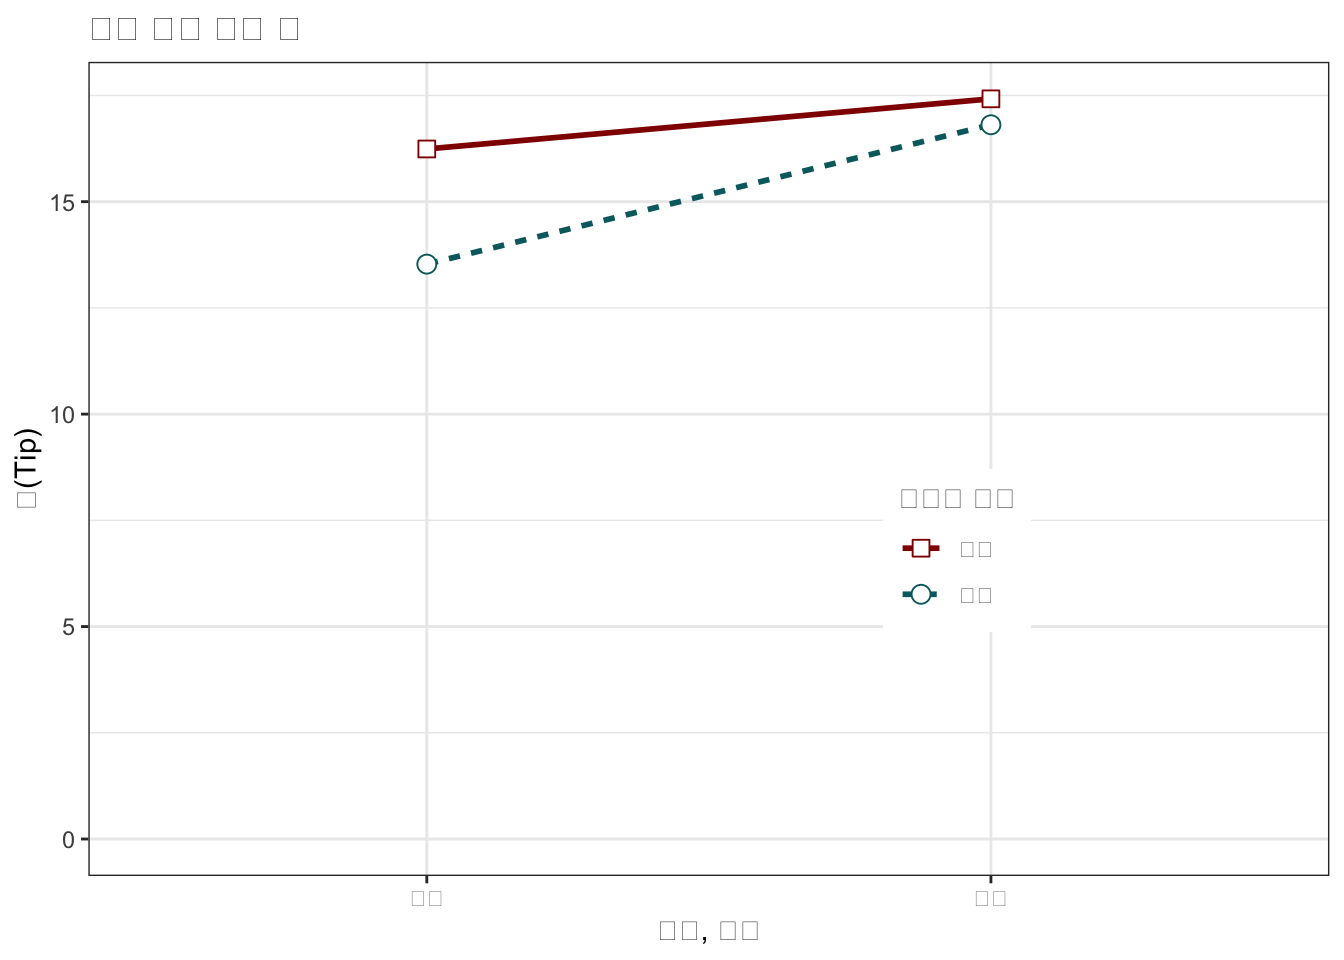
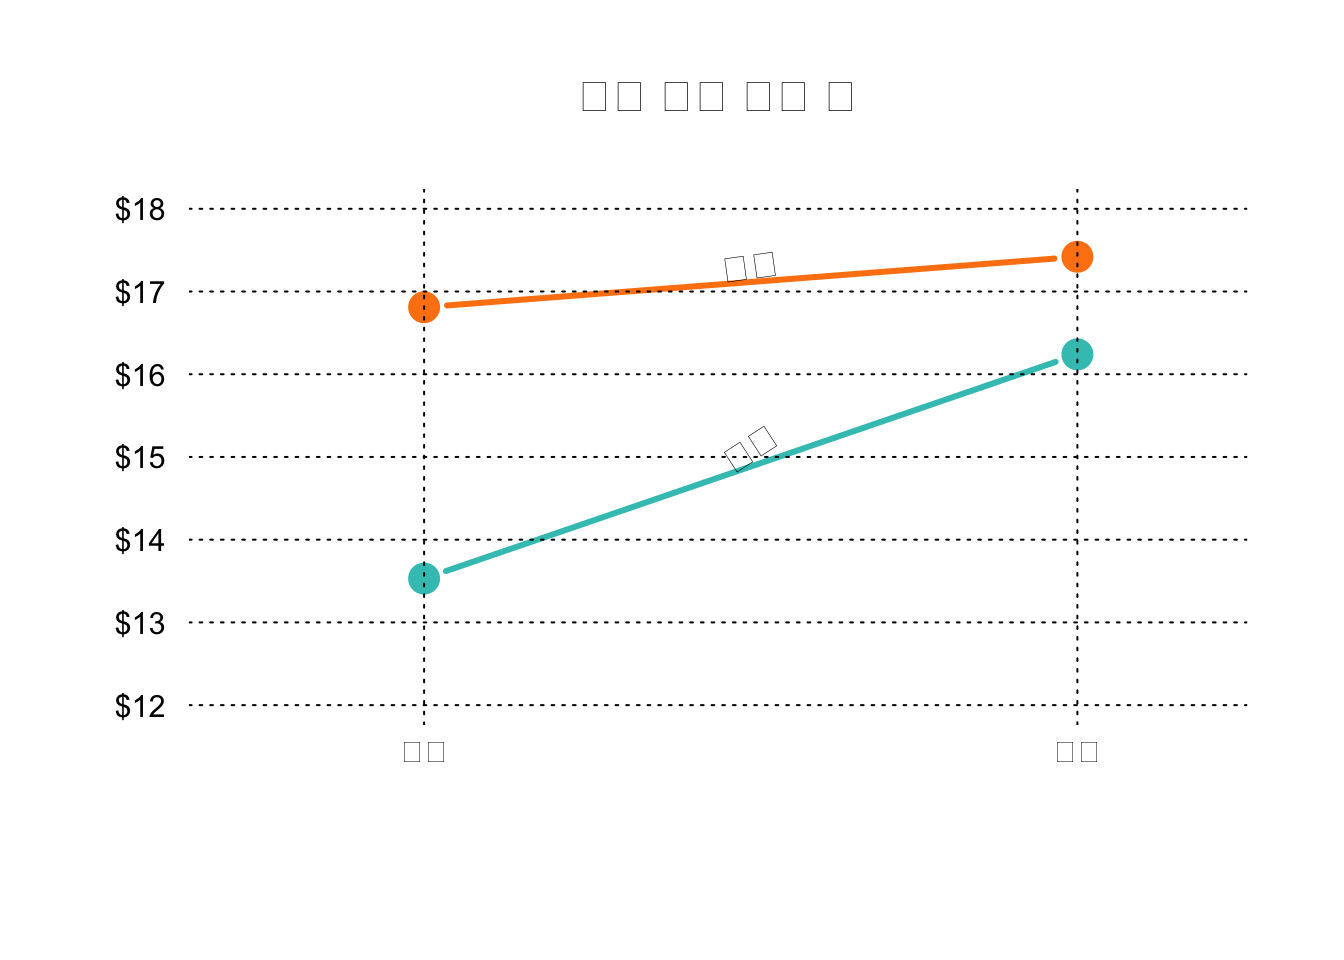
par(cex=1.2, cex.axis=1.1)
matplot(bill_mat, type="b", lty=1, pch=19, col=mf_col,
cex=1.5, lwd=3, las=1, bty="n", xaxt="n",
xlim=c(0.7, 2.2), ylim=c(12,18), ylab="",
main="식사 결재 평균 팁", yaxt="n")
axis(2, at=axTicks(2), labels=sprintf("$%s", axTicks(2)),
las=1, cex.axis=0.8, col=NA, line = -0.5)
grid(NA, NULL, lty=3, lwd=1, col="#000000")
abline(v=c(1,2), lty=3, lwd=1, col="#000000")
mtext("점심", side=1, at=1)
mtext("저녁", side=1, at=2)
text(1.5, 17.3, "남성", srt=8, font=3)
text(1.5, 15.1, "여성", srt=33, font=3)