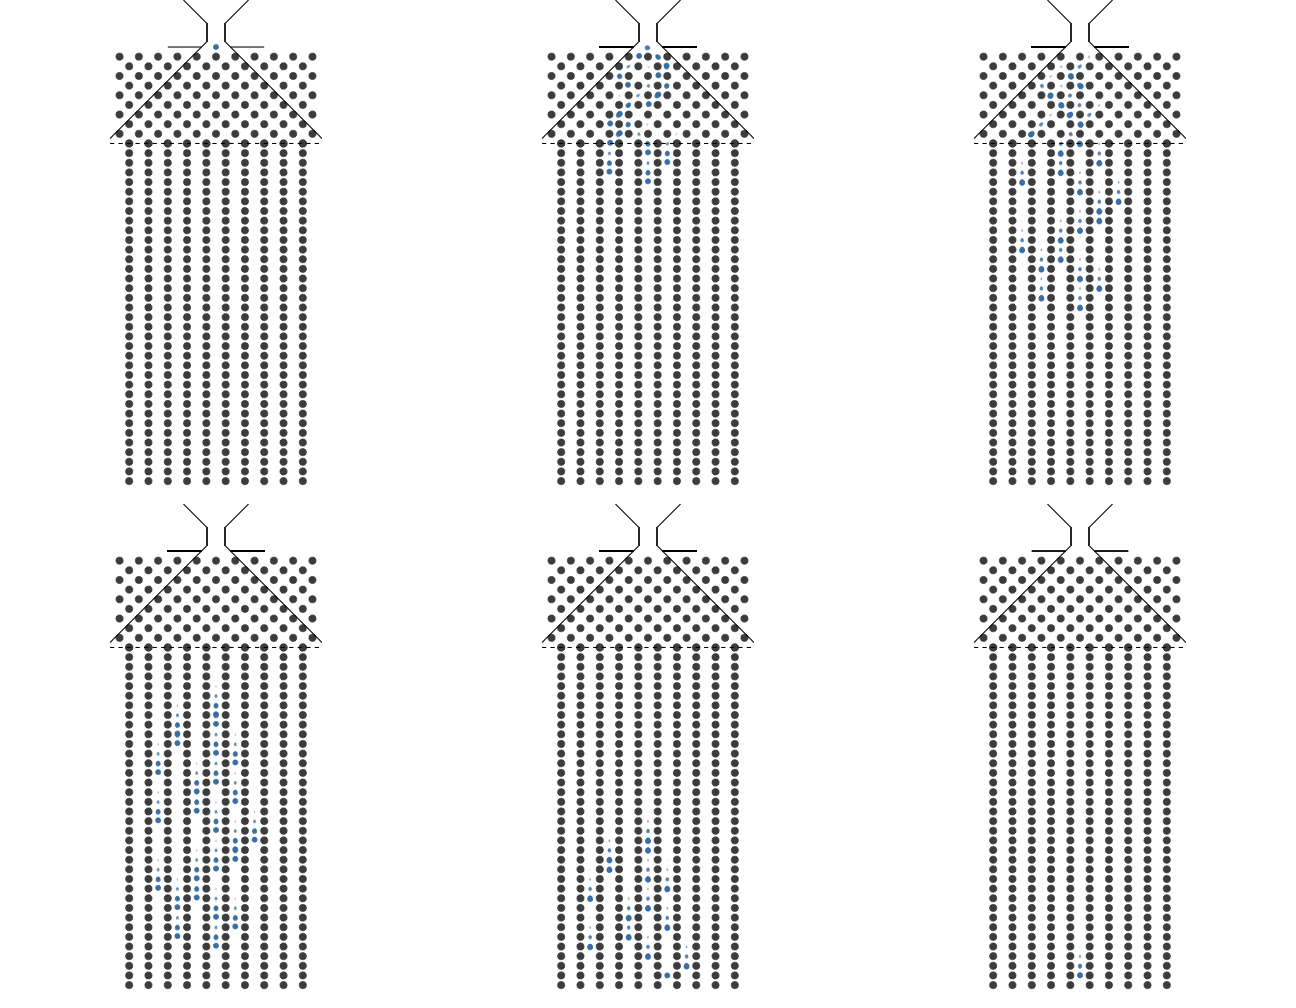
class: title-slide, left, bottom # 기초통계 ---- ## **통계에 대한 다양한 기본지식을 학습합니다.** ### 이광춘 ### 2022년 12월 27일 --- class: inverse, middle name: digital-ranking # 강의 개요 ---- .pull-left[ 4차 산업혁명은 .warmyellow[**디지털 전환(Digital Transformation)**] 이라는 용어로 대체되고 있으며 전세계가 디지털 전환을 통해 새로운 도약을 준비하고 있다. 이를 위해서 디지털 전환을 떠받치고 있는 **데이터 과학**을 심도 깊이 다루기 전에 그 기반기술을 차례차례 살펴보자. 데이터 과학을 구성하는 통계학과 기계학습이 큰 축으로 볼 수 있다. ] .pull-right[ .left[ 1\. **[.warmyellow[통계학]](#digital-ranking)** <br><br> 1\.1\. 중심극한정리 <br> 2\. [마무리](#goodbye) ] ] <!--end of right-column--> <!---------------------- 1. 중심극한정리(정규분포) -------------------------------------> --- name: statistics-clt # 중심극한정리 ### 직관적 설명 > 동일한 확률분포를 가진 독립 확률 변수로부터 추출한 `n`개 평균 분포는 `n`이 적당히 크다면 정규분포에 가까워진다는 정리이다. 특히 동일한 확률분포가 정규분포가 아니더라도 관계없이 평균의 분포는 정규분포를 따른다. ### 수식 [린데베르그–레비](https://ko.wikipedia.org/wiki/중심_극한_정리) 중심극한정리(Lindeberg–Lévy central limit theorem)에 따르면, 같은 분포를 가지는 독립 확률 변수에 대해 다룬다. 이 정리는 다음과 같다. 만약 확률 변수 `\(X_1, X_2, \cdots\)`들이 - 서로 독립적이고, - 같은 확률 분포를 가지고, - 그 확률 분포의 기댓값 `\(\mu\)`와 `\(\sigma\)`가 유한하다면, 평균 `\(S_n = \frac{(X_1 + \cdots + X_n)}{n}\)`의 분포는 기댓값 `\(\mu\)`와 표준편차 `\(\frac{\sigma}{\sqrt{n}}\)`인 `\(\mathcal{N}(\mu,\,\frac{\sigma^{2}}{n})\)`에 분포수렴한다. 즉, 다음이 성립한다. `$$\sqrt{n}\bigg(\frac{ \sum_{i=1}^n X_i}{n} - \mu\bigg)\ \xrightarrow{d}\ \mathcal{N}(0,\;\sigma^2)$$` ### 함의 > 모집단에서 추출한 표본으로부터 모집단의 평균 `\(\mu\)` 을 **추정(estimation)**하는데 유용하고, 이를 통해서 추정값이 모평균과 얼마나 차이가 날지 대략적인 정보도 얻을 수 있다. --- name: normal-in-action # 정규분포 .panelset[ .panel[.panel-name[골턴 보드] .center[ <img src="fig/galton-board.png" alt="프랜시스 골턴" width="25%" /> ] ] .panel[.panel-name[동영상] <br> .center[ <iframe width="560" height="315" src="https://www.youtube.com/embed/EvHiee7gs9Y" title="YouTube video player" frameborder="0" allow="accelerometer; autoplay; clipboard-write; encrypted-media; gyroscope; picture-in-picture" allowfullscreen></iframe> ] ] .panel[.panel-name[모의실험] <br> .center[ <iframe width="560" height="315" src="fig/yihui-animation.mp4" frameborder="0" allow="accelerometer; autoplay; clipboard-write; encrypted-media; gyroscope; picture-in-picture" allowfullscreen data-external="1"></iframe> ] ] .panel[.panel-name[실제사례 - 신장] .center[ <img src="fig/육군_신장.png" alt="프랜시스 골턴" width="60%" /> ] ] .panel[.panel-name[미국 대학생 신장] <br> .center[ <img src="fig/normal-in-action.png" alt="실제 정규분포" width="100%" /> ] ] ] .footnote[ - [육군 신체측정정보 : 육군 신체측정 데이터(수시 업데이터)](https://opendata.mnd.go.kr/openinf/sheetview2.jsp?infId=OA-9425) ] --- name: galton-code # 구현 .panelset[ .panel[.panel-name[코드] ```r library(tidyverse) # options(gganimate.nframes = 400, scipen = 10) ## 설정 -------------- n <- 70 # number of ball bearnings stop_level <- 10 # number of perturbation levels # make it an even number levels <- 44 # greater than stop_levels ## 데이터셋 ----------- set.seed(2019) ball_bearings <- crossing(unit_id = 1:n, level = 1:levels - 1) %>% mutate(perturbation = # moves sample(c(-1,1), # left or right n(), # each ball at each level replace = T)) %>% group_by(unit_id) %>% # operations on each ball mutate(perturbation = ifelse(row_number() == 1, yes = 0, # start centered no = perturbation)) %>% # each ball should release one at a time mutate(time = # displacing them in time w/ row_number() + # using unit id unit_id * 3 - 1) %>% filter(time > 0) %>% mutate(x_position = # we get the x position # by summing the cumulative distributions cumsum(perturbation)) %>% # if ball is beyond the perturbation levels mutate(x_position = # we overwrite the x position ifelse(level <= stop_level, yes = x_position, no = NA)) %>% # then fill in with the last x position fill(x_position) %>% ungroup() ## 최종 관측점---------- ball_bearings %>% filter(level == (levels - 1) ) %>% rename(final_time = time) %>% crossing(time = as.numeric(1:max(ball_bearings$time))) %>% group_by(time, x_position) %>% summarise(x_position_count = sum(time > final_time)) -> ball_bearings_collect ## 갤톤 상자 pegs <- crossing(unit_id = -stop_level:stop_level, level = 1:stop_level) %>% mutate(transparent = (unit_id + level) %% 2) # Lets make walls walls <- crossing(unit_id = -(stop_level + 1):(stop_level + 1), level = stop_level:levels) %>% mutate(transparent = unit_id %% 2) ball_bearings_size <- 2 peg_size <- 3 ## 정적 그래프 galton_static <- ggplot(ball_bearings) + aes(y = level) + aes(x = x_position) + scale_y_reverse() + aes(group = unit_id) + geom_point(data = walls, aes(x = unit_id, alpha = transparent), col = "grey30", size = peg_size) + geom_point(data = pegs, aes(x = unit_id, alpha = transparent), col = "grey30", size = peg_size) + geom_segment(x = -sqrt(n), xend = -1.5, y = 0, yend = 0) + geom_segment(x = sqrt(n), xend = 1.5, y = 0, yend = 0) + geom_abline(intercept = 1.5, slope = -1) + geom_abline(intercept = 1.5, slope = 1) + annotate(geom = "tile", height = 2, width = 2, x = 0 , y = -1.5) + annotate(geom = "tile", height = 2, width = 1.75, x = 0 , y = -1.5, fill = "white") + geom_rect(data = ball_bearings_collect, mapping = aes(xmin = x_position - .35, xmax = x_position + .35, ymax = max(ball_bearings$level) + 1 - x_position_count*1.5, ymin = max(ball_bearings$level) + 1, group = x_position, y = NULL, x = NULL), fill = "darkgrey") + geom_point(size = ball_bearings_size, col = "steelblue") + coord_equal() + geom_hline(yintercept = stop_level, linetype = "dotted") + scale_alpha_continuous(range = c(0, 1), guide = F) + theme_void() # galton_static ## 애니메이션 # galton_static + # gganimate::transition_time(time = time) + # gganimate::shadow_wake(wake_length = .05) + # gganimate::ease_aes("bounce-in-out") #BREAK ``` ] .panel[.panel-name[정적 그래프] <img src="statistics_files/figure-html/galton-ggplot-output-1.png" width="80%" style="display: block; margin: auto;" /> ] .panel[.panel-name[디지털 트윈] .center[  ] ] ] ] .footnote[ - 코드출처: [Minimal Galton Board - Gina Reynolds](https://evamaerey.github.io/statistics/galton_board.html) ] <!-- -------------------- 99. 마무리 ----------------------------- --> --- name: goodbye class: middle, inverse .pull-left[ # **경청해 주셔서 <br>감사합니다.** <br/> ] .pull-right[ .right[ <img style="border-radius: 100%;" src="fig/korea_R_logo.png" width="300px"/> ] ]