class: center, middle, inverse, title-slide .title[ # 통계학 ] .subtitle[ ## 회귀모형 ] .author[ ### 이광춘 ] --- # 데이터셋 ← chatGPT .pull-left[ <img src="fig/chatGPT_dataset.png" alt="GPT" width="100%" /> ] .pull-right[ > This dataset includes data on the **temperature (in degrees Fahrenheit)**, **humidity (as a fraction between 0 and 1)**, and **ice cream sales (in units)**. You can use this dataset to fit a linear regression model to predict ice cream sales based on temperature and humidity. ] --- # 데이터셋 정제 .pull-left[ ```r library(tidyverse) library(flipbookr) sales_raw <- tribble( ~"Temperature", ~"Humidity", ~"Ice Cream Sales", 60,0.5,50, 65,0.6,70, 70,0.7,100, 75,0.8,120, 80,0.9,150, 85,1.0,200, 90,1.1,250, 95,1.2,300, 100,1.3,350) sales_df <- sales_raw %>% set_names(c("온도", "습도", "매출")) ``` ] .pull-right[ ``` # A tibble: 9 × 3 온도 습도 매출 <dbl> <dbl> <dbl> 1 60 0.5 50 2 65 0.6 70 3 70 0.7 100 4 75 0.8 120 5 80 0.9 150 6 85 1 200 7 90 1.1 250 8 95 1.2 300 9 100 1.3 350 ``` ] --- count: false ### 단순 회귀모형 시각화 .panel1-ols_viz-1[ ```r sales_df %>% ggplot() + aes(x = 온도) + aes(y = 매출) + geom_point(color = "steelblue", size = 2) + geom_smooth(method = lm, se = F) + labs(title = "아이스크림 매출 예측", subtitle = "예측변수: 온도") ``` ] .panel2-ols_viz-1[ 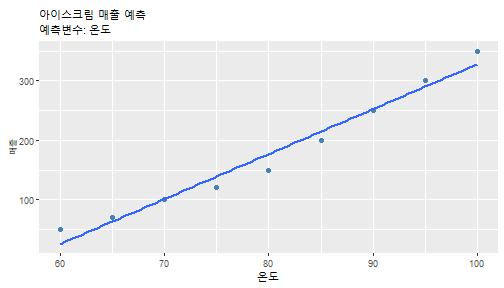<!-- --> ] <style> .panel1-ols_viz-1 { color: black; width: 38.6060606060606%; hight: 32%; float: left; padding-left: 1%; font-size: 80% } .panel2-ols_viz-1 { color: black; width: 59.3939393939394%; hight: 32%; float: left; padding-left: 1%; font-size: 80% } .panel3-ols_viz-1 { color: black; width: NA%; hight: 33%; float: left; padding-left: 1%; font-size: 80% } </style> --- class: inverse, center, middle # 단순 회귀모형 --- count: false ### 회귀모형 개발 .panel1-base_ols-auto[ ```r # 데이터에 모형적합 *lm(formula = 매출 ~ 온도, * data = sales_df) ``` ] .panel2-base_ols-auto[ ``` Call: lm(formula = 매출 ~ 온도, data = sales_df) Coefficients: (Intercept) 온도 -428.667 7.567 ``` ] --- count: false ### 회귀모형 개발 .panel1-base_ols-auto[ ```r # 데이터에 모형적합 lm(formula = 매출 ~ 온도, data = sales_df) -> *sales_model ``` ] .panel2-base_ols-auto[ ] --- count: false ### 회귀모형 개발 .panel1-base_ols-auto[ ```r # 데이터에 모형적합 lm(formula = 매출 ~ 온도, data = sales_df) -> sales_model # 모형 적합 후 잔차 *sales_model ``` ] .panel2-base_ols-auto[ ``` Call: lm(formula = 매출 ~ 온도, data = sales_df) Coefficients: (Intercept) 온도 -428.667 7.567 ``` ] --- count: false ### 회귀모형 개발 .panel1-base_ols-auto[ ```r # 데이터에 모형적합 lm(formula = 매출 ~ 온도, data = sales_df) -> sales_model # 모형 적합 후 잔차 sales_model %>% * summary() ``` ] .panel2-base_ols-auto[ ``` Call: lm(formula = 매출 ~ 온도, data = sales_df) Residuals: Min 1Q Median 3Q Max -26.667 -14.500 -1.000 9.833 24.667 Coefficients: Estimate Std. Error t value Pr(>|t|) (Intercept) -428.6667 39.6857 -10.80 1.28e-05 *** 온도 7.5667 0.4897 15.45 1.15e-06 *** --- Signif. codes: 0 '***' 0.001 '**' 0.01 '*' 0.05 '.' 0.1 ' ' 1 Residual standard error: 18.97 on 7 degrees of freedom Multiple R-squared: 0.9715, Adjusted R-squared: 0.9674 F-statistic: 238.7 on 1 and 7 DF, p-value: 1.148e-06 ``` ] --- count: false ### 회귀모형 개발 .panel1-base_ols-auto[ ```r # 데이터에 모형적합 lm(formula = 매출 ~ 온도, data = sales_df) -> sales_model # 모형 적합 후 잔차 sales_model %>% summary() %>% * .$residuals ``` ] .panel2-base_ols-auto[ ``` 1 2 3 4 5 6 7 24.666667 6.833333 -1.000000 -18.833333 -26.666667 -14.500000 -2.333333 8 9 9.833333 22.000000 ``` ] <style> .panel1-base_ols-auto { color: black; width: 38.6060606060606%; hight: 32%; float: left; padding-left: 1%; font-size: 80% } .panel2-base_ols-auto { color: black; width: 59.3939393939394%; hight: 32%; float: left; padding-left: 1%; font-size: 80% } .panel3-base_ols-auto { color: black; width: NA%; hight: 33%; float: left; padding-left: 1%; font-size: 80% } </style> --- # 모형이 맞나? - `broom` <br> <br> <br> - broom::glance(), 모형(model) 수준에서 통계량 정보 - broom::tidy(), 공변수(covariate) 수준에서 통계량 정보 - broom::augment(), 관측점(observation) 수준에서 통계량 정보 --- count: false ### *모형* 수준 통계량 .panel1-broom_glance-auto[ ```r *sales_model NA ``` ] .panel2-broom_glance-auto[ ``` Call: lm(formula = 매출 ~ 온도, data = sales_df) Coefficients: (Intercept) 온도 -428.667 7.567 ``` ``` [1] NA ``` ] --- count: false ### *모형* 수준 통계량 .panel1-broom_glance-auto[ ```r sales_model %>% * broom::glance() NA ``` ] .panel2-broom_glance-auto[ ``` # A tibble: 1 × 12 r.squ…¹ adj.r…² sigma stati…³ p.value df logLik AIC BIC devia…⁴ df.re…⁵ <dbl> <dbl> <dbl> <dbl> <dbl> <dbl> <dbl> <dbl> <dbl> <dbl> <int> 1 0.972 0.967 19.0 239. 1.15e-6 1 -38.1 82.2 82.8 2518. 7 # … with 1 more variable: nobs <int>, and abbreviated variable names # ¹r.squared, ²adj.r.squared, ³statistic, ⁴deviance, ⁵df.residual ``` ``` [1] NA ``` ] --- count: false ### *모형* 수준 통계량 .panel1-broom_glance-auto[ ```r sales_model %>% broom::glance() %>% * pivot_longer(cols = everything(), * names_to = "통계량", * values_to = "값") NA ``` ] .panel2-broom_glance-auto[ ``` # A tibble: 12 × 2 통계량 값 <chr> <dbl> 1 r.squared 0.972 2 adj.r.squared 0.967 3 sigma 19.0 4 statistic 239. 5 p.value 0.00000115 6 df 1 7 logLik -38.1 8 AIC 82.2 9 BIC 82.8 10 deviance 2518. 11 df.residual 7 12 nobs 9 ``` ``` [1] NA ``` ] --- count: false ### *모형* 수준 통계량 .panel1-broom_glance-auto[ ```r sales_model %>% broom::glance() %>% pivot_longer(cols = everything(), names_to = "통계량", values_to = "값") -> * sales_glance NA ``` ] .panel2-broom_glance-auto[ ``` [1] NA ``` ] --- count: false ### *모형* 수준 통계량 .panel1-broom_glance-auto[ ```r sales_model %>% broom::glance() %>% pivot_longer(cols = everything(), names_to = "통계량", values_to = "값") -> sales_glance *sales_glance NA ``` ] .panel2-broom_glance-auto[ ``` # A tibble: 12 × 2 통계량 값 <chr> <dbl> 1 r.squared 0.972 2 adj.r.squared 0.967 3 sigma 19.0 4 statistic 239. 5 p.value 0.00000115 6 df 1 7 logLik -38.1 8 AIC 82.2 9 BIC 82.8 10 deviance 2518. 11 df.residual 7 12 nobs 9 ``` ``` [1] NA ``` ] <style> .panel1-broom_glance-auto { color: black; width: 38.6060606060606%; hight: 32%; float: left; padding-left: 1%; font-size: 80% } .panel2-broom_glance-auto { color: black; width: 59.3939393939394%; hight: 32%; float: left; padding-left: 1%; font-size: 80% } .panel3-broom_glance-auto { color: black; width: NA%; hight: 33%; float: left; padding-left: 1%; font-size: 80% } </style> --- count: false ### *공변수* 수준 통계량 .panel1-broom_tidy-auto[ ```r *sales_model NA ``` ] .panel2-broom_tidy-auto[ ``` Call: lm(formula = 매출 ~ 온도, data = sales_df) Coefficients: (Intercept) 온도 -428.667 7.567 ``` ``` [1] NA ``` ] --- count: false ### *공변수* 수준 통계량 .panel1-broom_tidy-auto[ ```r sales_model %>% * broom::tidy() NA ``` ] .panel2-broom_tidy-auto[ ``` # A tibble: 2 × 5 term estimate std.error statistic p.value <chr> <dbl> <dbl> <dbl> <dbl> 1 (Intercept) -429. 39.7 -10.8 0.0000128 2 온도 7.57 0.490 15.5 0.00000115 ``` ``` [1] NA ``` ] <style> .panel1-broom_tidy-auto { color: black; width: 38.6060606060606%; hight: 32%; float: left; padding-left: 1%; font-size: 80% } .panel2-broom_tidy-auto { color: black; width: 59.3939393939394%; hight: 32%; float: left; padding-left: 1%; font-size: 80% } .panel3-broom_tidy-auto { color: black; width: NA%; hight: 33%; float: left; padding-left: 1%; font-size: 80% } </style> --- count: false ### *관측점* 수준 통계량 .panel1-broom_augment-auto[ ```r *sales_model NA ``` ] .panel2-broom_augment-auto[ ``` Call: lm(formula = 매출 ~ 온도, data = sales_df) Coefficients: (Intercept) 온도 -428.667 7.567 ``` ``` [1] NA ``` ] --- count: false ### *관측점* 수준 통계량 .panel1-broom_augment-auto[ ```r sales_model %>% * broom::augment() NA ``` ] .panel2-broom_augment-auto[ ``` # A tibble: 9 × 8 매출 온도 .fitted .resid .hat .sigma .cooksd .std.resid <dbl> <dbl> <dbl> <dbl> <dbl> <dbl> <dbl> <dbl> 1 50 60 25.3 24.7 0.378 16.0 0.825 1.65 2 70 65 63.2 6.83 0.261 20.2 0.0310 0.419 3 100 70 101 -1.00 0.178 20.5 0.000365 -0.0581 4 120 75 139. -18.8 0.128 18.8 0.0828 -1.06 5 150 80 177. -26.7 0.111 16.9 0.139 -1.49 6 200 85 214. -14.5 0.128 19.5 0.0491 -0.819 7 250 90 252. -2.33 0.178 20.5 0.00199 -0.136 8 300 95 290. 9.83 0.261 19.9 0.0643 0.603 9 350 100 328 22.0 0.378 17.0 0.656 1.47 ``` ``` [1] NA ``` ] <style> .panel1-broom_augment-auto { color: black; width: 38.6060606060606%; hight: 32%; float: left; padding-left: 1%; font-size: 80% } .panel2-broom_augment-auto { color: black; width: 59.3939393939394%; hight: 32%; float: left; padding-left: 1%; font-size: 80% } .panel3-broom_augment-auto { color: black; width: NA%; hight: 33%; float: left; padding-left: 1%; font-size: 80% } </style> --- count: false .panel1-broom_augment_viz-auto[ ```r *sales_model ``` ] .panel2-broom_augment_viz-auto[ ``` Call: lm(formula = 매출 ~ 온도, data = sales_df) Coefficients: (Intercept) 온도 -428.667 7.567 ``` ] --- count: false .panel1-broom_augment_viz-auto[ ```r sales_model %>% * broom::augment() ``` ] .panel2-broom_augment_viz-auto[ ``` # A tibble: 9 × 8 매출 온도 .fitted .resid .hat .sigma .cooksd .std.resid <dbl> <dbl> <dbl> <dbl> <dbl> <dbl> <dbl> <dbl> 1 50 60 25.3 24.7 0.378 16.0 0.825 1.65 2 70 65 63.2 6.83 0.261 20.2 0.0310 0.419 3 100 70 101 -1.00 0.178 20.5 0.000365 -0.0581 4 120 75 139. -18.8 0.128 18.8 0.0828 -1.06 5 150 80 177. -26.7 0.111 16.9 0.139 -1.49 6 200 85 214. -14.5 0.128 19.5 0.0491 -0.819 7 250 90 252. -2.33 0.178 20.5 0.00199 -0.136 8 300 95 290. 9.83 0.261 19.9 0.0643 0.603 9 350 100 328 22.0 0.378 17.0 0.656 1.47 ``` ] --- count: false .panel1-broom_augment_viz-auto[ ```r sales_model %>% broom::augment() %>% * ggplot() ``` ] .panel2-broom_augment_viz-auto[ <!-- --> ] --- count: false .panel1-broom_augment_viz-auto[ ```r sales_model %>% broom::augment() %>% ggplot() + * aes(x = `온도`) ``` ] .panel2-broom_augment_viz-auto[ <!-- --> ] --- count: false .panel1-broom_augment_viz-auto[ ```r sales_model %>% broom::augment() %>% ggplot() + aes(x = `온도`) + * aes(y = `매출`) ``` ] .panel2-broom_augment_viz-auto[ <!-- --> ] --- count: false .panel1-broom_augment_viz-auto[ ```r sales_model %>% broom::augment() %>% ggplot() + aes(x = `온도`) + aes(y = `매출`) + * geom_point(col = "steelblue", size = 3) ``` ] .panel2-broom_augment_viz-auto[ 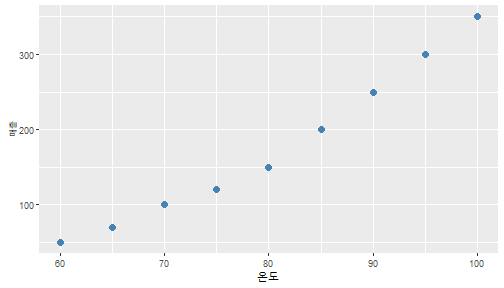<!-- --> ] --- count: false .panel1-broom_augment_viz-auto[ ```r sales_model %>% broom::augment() %>% ggplot() + aes(x = `온도`) + aes(y = `매출`) + geom_point(col = "steelblue", size = 3) + * geom_smooth(method = lm, se = F) ``` ] .panel2-broom_augment_viz-auto[ 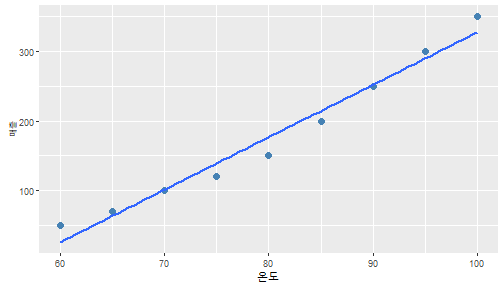<!-- --> ] --- count: false .panel1-broom_augment_viz-auto[ ```r sales_model %>% broom::augment() %>% ggplot() + aes(x = `온도`) + aes(y = `매출`) + geom_point(col = "steelblue", size = 3) + geom_smooth(method = lm, se = F) + * geom_point(aes(y = .fitted)) ``` ] .panel2-broom_augment_viz-auto[ 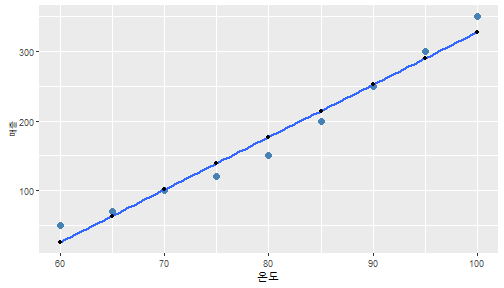<!-- --> ] --- count: false .panel1-broom_augment_viz-auto[ ```r sales_model %>% broom::augment() %>% ggplot() + aes(x = `온도`) + aes(y = `매출`) + geom_point(col = "steelblue", size = 3) + geom_smooth(method = lm, se = F) + geom_point(aes(y = .fitted)) + * aes(xend = 온도) ``` ] .panel2-broom_augment_viz-auto[ 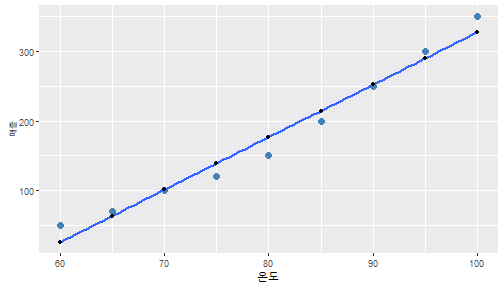<!-- --> ] --- count: false .panel1-broom_augment_viz-auto[ ```r sales_model %>% broom::augment() %>% ggplot() + aes(x = `온도`) + aes(y = `매출`) + geom_point(col = "steelblue", size = 3) + geom_smooth(method = lm, se = F) + geom_point(aes(y = .fitted)) + aes(xend = 온도) + * aes(yend = .fitted) ``` ] .panel2-broom_augment_viz-auto[ 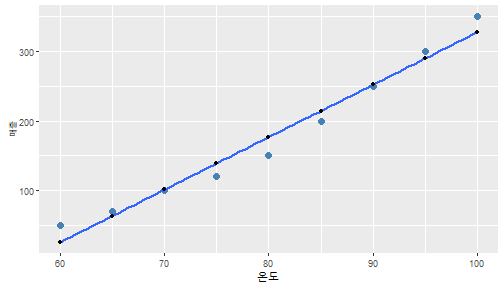<!-- --> ] --- count: false .panel1-broom_augment_viz-auto[ ```r sales_model %>% broom::augment() %>% ggplot() + aes(x = `온도`) + aes(y = `매출`) + geom_point(col = "steelblue", size = 3) + geom_smooth(method = lm, se = F) + geom_point(aes(y = .fitted)) + aes(xend = 온도) + aes(yend = .fitted) + * geom_segment(color = "red", * linetype = "dashed") ``` ] .panel2-broom_augment_viz-auto[ 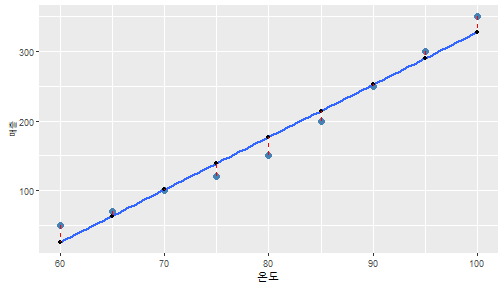<!-- --> ] --- count: false .panel1-broom_augment_viz-auto[ ```r sales_model %>% broom::augment() %>% ggplot() + aes(x = `온도`) + aes(y = `매출`) + geom_point(col = "steelblue", size = 3) + geom_smooth(method = lm, se = F) + geom_point(aes(y = .fitted)) + aes(xend = 온도) + aes(yend = .fitted) + geom_segment(color = "red", linetype = "dashed") + # 평균온도 * geom_vline(xintercept = 80, * linetype = "dotted") ``` ] .panel2-broom_augment_viz-auto[ 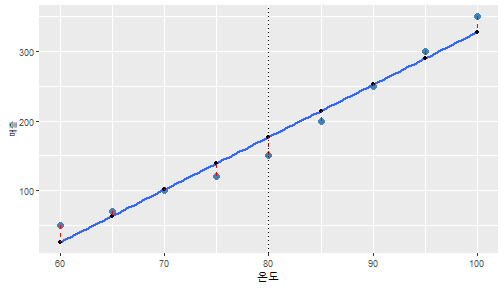<!-- --> ] --- count: false .panel1-broom_augment_viz-auto[ ```r sales_model %>% broom::augment() %>% ggplot() + aes(x = `온도`) + aes(y = `매출`) + geom_point(col = "steelblue", size = 3) + geom_smooth(method = lm, se = F) + geom_point(aes(y = .fitted)) + aes(xend = 온도) + aes(yend = .fitted) + geom_segment(color = "red", linetype = "dashed") + # 평균온도 geom_vline(xintercept = 80, linetype = "dotted") + # 평균온도 대입 시 예상매출 * geom_hline(yintercept = * predict(sales_model, * data.frame(온도 = 80)), * linetype = "dotted") ``` ] .panel2-broom_augment_viz-auto[ 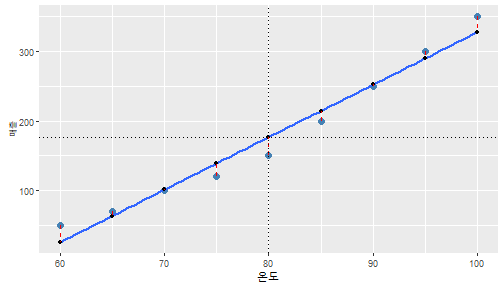<!-- --> ] --- count: false .panel1-broom_augment_viz-auto[ ```r sales_model %>% broom::augment() %>% ggplot() + aes(x = `온도`) + aes(y = `매출`) + geom_point(col = "steelblue", size = 3) + geom_smooth(method = lm, se = F) + geom_point(aes(y = .fitted)) + aes(xend = 온도) + aes(yend = .fitted) + geom_segment(color = "red", linetype = "dashed") + # 평균온도 geom_vline(xintercept = 80, linetype = "dotted") + # 평균온도 대입 시 예상매출 geom_hline(yintercept = predict(sales_model, data.frame(온도 = 80)), linetype = "dotted") + * labs(title = "모형적합 시각화") ``` ] .panel2-broom_augment_viz-auto[ 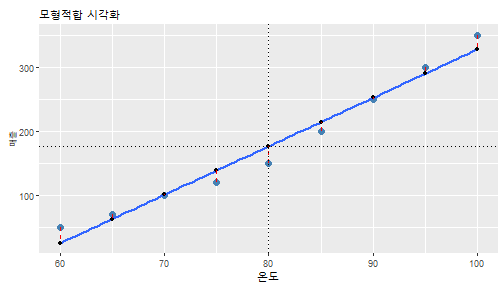<!-- --> ] <style> .panel1-broom_augment_viz-auto { color: black; width: 38.6060606060606%; hight: 32%; float: left; padding-left: 1%; font-size: 80% } .panel2-broom_augment_viz-auto { color: black; width: 59.3939393939394%; hight: 32%; float: left; padding-left: 1%; font-size: 80% } .panel3-broom_augment_viz-auto { color: black; width: NA%; hight: 33%; float: left; padding-left: 1%; font-size: 80% } </style> --- count: false ### 이상점 - 쿡의 거리 .panel1-sales_cooks-auto[ ```r *sales_model NA ``` ] .panel2-sales_cooks-auto[ ``` Call: lm(formula = 매출 ~ 온도, data = sales_df) Coefficients: (Intercept) 온도 -428.667 7.567 ``` ``` [1] NA ``` ] --- count: false ### 이상점 - 쿡의 거리 .panel1-sales_cooks-auto[ ```r sales_model %>% * broom::augment() NA ``` ] .panel2-sales_cooks-auto[ ``` # A tibble: 9 × 8 매출 온도 .fitted .resid .hat .sigma .cooksd .std.resid <dbl> <dbl> <dbl> <dbl> <dbl> <dbl> <dbl> <dbl> 1 50 60 25.3 24.7 0.378 16.0 0.825 1.65 2 70 65 63.2 6.83 0.261 20.2 0.0310 0.419 3 100 70 101 -1.00 0.178 20.5 0.000365 -0.0581 4 120 75 139. -18.8 0.128 18.8 0.0828 -1.06 5 150 80 177. -26.7 0.111 16.9 0.139 -1.49 6 200 85 214. -14.5 0.128 19.5 0.0491 -0.819 7 250 90 252. -2.33 0.178 20.5 0.00199 -0.136 8 300 95 290. 9.83 0.261 19.9 0.0643 0.603 9 350 100 328 22.0 0.378 17.0 0.656 1.47 ``` ``` [1] NA ``` ] --- count: false ### 이상점 - 쿡의 거리 .panel1-sales_cooks-auto[ ```r sales_model %>% broom::augment() %>% * mutate(id = row_number()) NA ``` ] .panel2-sales_cooks-auto[ ``` # A tibble: 9 × 9 매출 온도 .fitted .resid .hat .sigma .cooksd .std.resid id <dbl> <dbl> <dbl> <dbl> <dbl> <dbl> <dbl> <dbl> <int> 1 50 60 25.3 24.7 0.378 16.0 0.825 1.65 1 2 70 65 63.2 6.83 0.261 20.2 0.0310 0.419 2 3 100 70 101 -1.00 0.178 20.5 0.000365 -0.0581 3 4 120 75 139. -18.8 0.128 18.8 0.0828 -1.06 4 5 150 80 177. -26.7 0.111 16.9 0.139 -1.49 5 6 200 85 214. -14.5 0.128 19.5 0.0491 -0.819 6 7 250 90 252. -2.33 0.178 20.5 0.00199 -0.136 7 8 300 95 290. 9.83 0.261 19.9 0.0643 0.603 8 9 350 100 328 22.0 0.378 17.0 0.656 1.47 9 ``` ``` [1] NA ``` ] --- count: false ### 이상점 - 쿡의 거리 .panel1-sales_cooks-auto[ ```r sales_model %>% broom::augment() %>% mutate(id = row_number()) %>% * ggplot() NA ``` ] .panel2-sales_cooks-auto[ <!-- --> ``` [1] NA ``` ] --- count: false ### 이상점 - 쿡의 거리 .panel1-sales_cooks-auto[ ```r sales_model %>% broom::augment() %>% mutate(id = row_number()) %>% ggplot() + * aes(x = id) NA ``` ] .panel2-sales_cooks-auto[ <!-- --> ``` [1] NA ``` ] --- count: false ### 이상점 - 쿡의 거리 .panel1-sales_cooks-auto[ ```r sales_model %>% broom::augment() %>% mutate(id = row_number()) %>% ggplot() + aes(x = id) + * aes(y = .cooksd) NA ``` ] .panel2-sales_cooks-auto[ <!-- --> ``` [1] NA ``` ] --- count: false ### 이상점 - 쿡의 거리 .panel1-sales_cooks-auto[ ```r sales_model %>% broom::augment() %>% mutate(id = row_number()) %>% ggplot() + aes(x = id) + aes(y = .cooksd) + * geom_point() NA ``` ] .panel2-sales_cooks-auto[ 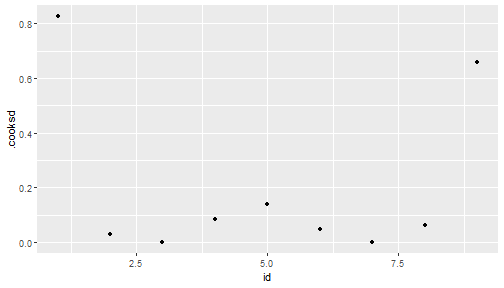<!-- --> ``` [1] NA ``` ] --- count: false ### 이상점 - 쿡의 거리 .panel1-sales_cooks-auto[ ```r sales_model %>% broom::augment() %>% mutate(id = row_number()) %>% ggplot() + aes(x = id) + aes(y = .cooksd) + geom_point() + * aes(label = id) NA ``` ] .panel2-sales_cooks-auto[ <!-- --> ``` [1] NA ``` ] --- count: false ### 이상점 - 쿡의 거리 .panel1-sales_cooks-auto[ ```r sales_model %>% broom::augment() %>% mutate(id = row_number()) %>% ggplot() + aes(x = id) + aes(y = .cooksd) + geom_point() + aes(label = id) + * geom_text(check_overlap = T, * nudge_y = .015) NA ``` ] .panel2-sales_cooks-auto[ 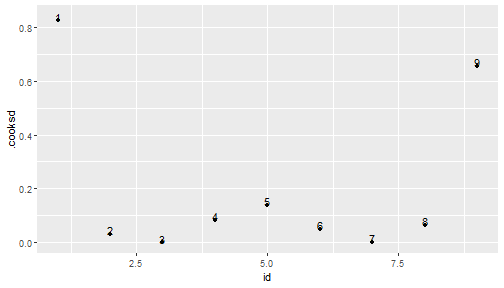<!-- --> ``` [1] NA ``` ] --- count: false ### 이상점 - 쿡의 거리 .panel1-sales_cooks-auto[ ```r sales_model %>% broom::augment() %>% mutate(id = row_number()) %>% ggplot() + aes(x = id) + aes(y = .cooksd) + geom_point() + aes(label = id) + geom_text(check_overlap = T, nudge_y = .015) + * labs(title = "관측점 별 쿡의 거리(Cook's Distance)") NA ``` ] .panel2-sales_cooks-auto[ 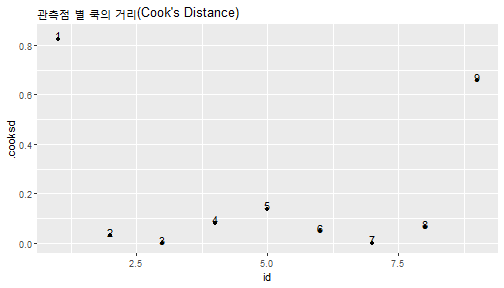<!-- --> ``` [1] NA ``` ] --- count: false ### 이상점 - 쿡의 거리 .panel1-sales_cooks-auto[ ```r sales_model %>% broom::augment() %>% mutate(id = row_number()) %>% ggplot() + aes(x = id) + aes(y = .cooksd) + geom_point() + aes(label = id) + geom_text(check_overlap = T, nudge_y = .015) + labs(title = "관측점 별 쿡의 거리(Cook's Distance)") + * labs(subtitle = "쿡의 거리: Leave one out 방법으로 관측점 영향도를 측정") NA ``` ] .panel2-sales_cooks-auto[ 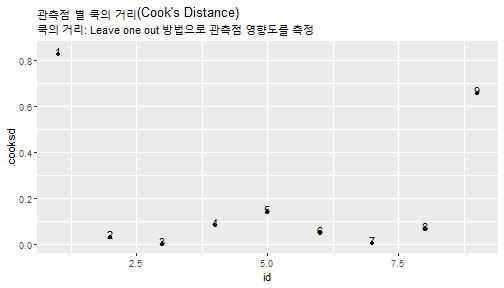<!-- --> ``` [1] NA ``` ] --- count: false ### 이상점 - 쿡의 거리 .panel1-sales_cooks-auto[ ```r sales_model %>% broom::augment() %>% mutate(id = row_number()) %>% ggplot() + aes(x = id) + aes(y = .cooksd) + geom_point() + aes(label = id) + geom_text(check_overlap = T, nudge_y = .015) + labs(title = "관측점 별 쿡의 거리(Cook's Distance)") + labs(subtitle = "쿡의 거리: Leave one out 방법으로 관측점 영향도를 측정") + * geom_hline(yintercept = 4 / nrow(sales_df), * color = "red", linetype = "dashed") # 컷오프: 4 / 표본크기 NA ``` ] .panel2-sales_cooks-auto[ 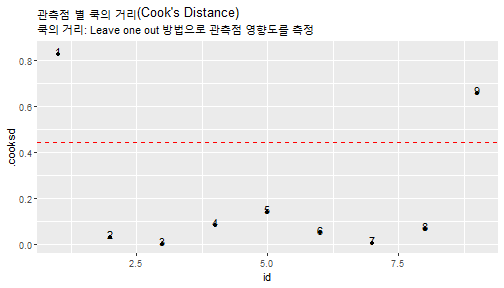<!-- --> ``` [1] NA ``` ] --- count: false ### 이상점 - 쿡의 거리 .panel1-sales_cooks-auto[ ```r sales_model %>% broom::augment() %>% mutate(id = row_number()) %>% ggplot() + aes(x = id) + aes(y = .cooksd) + geom_point() + aes(label = id) + geom_text(check_overlap = T, nudge_y = .015) + labs(title = "관측점 별 쿡의 거리(Cook's Distance)") + labs(subtitle = "쿡의 거리: Leave one out 방법으로 관측점 영향도를 측정") + geom_hline(yintercept = 4 / nrow(sales_df), color = "red", linetype = "dashed") + # 컷오프: 4 / 표본크기 * annotate("text", x = 5, y = 0.5, label = "이상점 판정기준", size = 7, color = "red") NA ``` ] .panel2-sales_cooks-auto[ 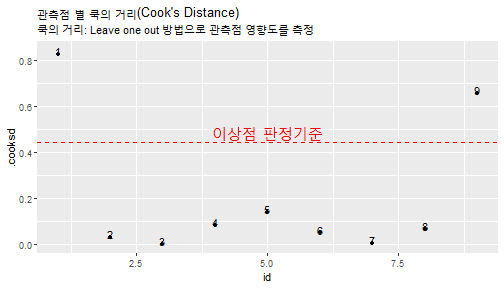<!-- --> ``` [1] NA ``` ] --- count: false ### 이상점 - 쿡의 거리 .panel1-sales_cooks-auto[ ```r sales_model %>% broom::augment() %>% mutate(id = row_number()) %>% ggplot() + aes(x = id) + aes(y = .cooksd) + geom_point() + aes(label = id) + geom_text(check_overlap = T, nudge_y = .015) + labs(title = "관측점 별 쿡의 거리(Cook's Distance)") + labs(subtitle = "쿡의 거리: Leave one out 방법으로 관측점 영향도를 측정") + geom_hline(yintercept = 4 / nrow(sales_df), color = "red", linetype = "dashed") + # 컷오프: 4 / 표본크기 annotate("text", x = 5, y = 0.5, label = "이상점 판정기준", size = 7, color = "red") NA ``` ] .panel2-sales_cooks-auto[ <!-- --> ``` [1] NA ``` ] <style> .panel1-sales_cooks-auto { color: black; width: 38.6060606060606%; hight: 32%; float: left; padding-left: 1%; font-size: 80% } .panel2-sales_cooks-auto { color: black; width: 59.3939393939394%; hight: 32%; float: left; padding-left: 1%; font-size: 80% } .panel3-sales_cooks-auto { color: black; width: NA%; hight: 33%; float: left; padding-left: 1%; font-size: 80% } </style> --- count: false ### 잔차는 정규분포? .panel1-sales_qqplot-auto[ ```r *sales_model NA ``` ] .panel2-sales_qqplot-auto[ ``` Call: lm(formula = 매출 ~ 온도, data = sales_df) Coefficients: (Intercept) 온도 -428.667 7.567 ``` ``` [1] NA ``` ] --- count: false ### 잔차는 정규분포? .panel1-sales_qqplot-auto[ ```r sales_model %>% * broom::augment() NA ``` ] .panel2-sales_qqplot-auto[ ``` # A tibble: 9 × 8 매출 온도 .fitted .resid .hat .sigma .cooksd .std.resid <dbl> <dbl> <dbl> <dbl> <dbl> <dbl> <dbl> <dbl> 1 50 60 25.3 24.7 0.378 16.0 0.825 1.65 2 70 65 63.2 6.83 0.261 20.2 0.0310 0.419 3 100 70 101 -1.00 0.178 20.5 0.000365 -0.0581 4 120 75 139. -18.8 0.128 18.8 0.0828 -1.06 5 150 80 177. -26.7 0.111 16.9 0.139 -1.49 6 200 85 214. -14.5 0.128 19.5 0.0491 -0.819 7 250 90 252. -2.33 0.178 20.5 0.00199 -0.136 8 300 95 290. 9.83 0.261 19.9 0.0643 0.603 9 350 100 328 22.0 0.378 17.0 0.656 1.47 ``` ``` [1] NA ``` ] --- count: false ### 잔차는 정규분포? .panel1-sales_qqplot-auto[ ```r sales_model %>% broom::augment() %>% * arrange(.std.resid) NA ``` ] .panel2-sales_qqplot-auto[ ``` # A tibble: 9 × 8 매출 온도 .fitted .resid .hat .sigma .cooksd .std.resid <dbl> <dbl> <dbl> <dbl> <dbl> <dbl> <dbl> <dbl> 1 150 80 177. -26.7 0.111 16.9 0.139 -1.49 2 120 75 139. -18.8 0.128 18.8 0.0828 -1.06 3 200 85 214. -14.5 0.128 19.5 0.0491 -0.819 4 250 90 252. -2.33 0.178 20.5 0.00199 -0.136 5 100 70 101 -1.00 0.178 20.5 0.000365 -0.0581 6 70 65 63.2 6.83 0.261 20.2 0.0310 0.419 7 300 95 290. 9.83 0.261 19.9 0.0643 0.603 8 350 100 328 22.0 0.378 17.0 0.656 1.47 9 50 60 25.3 24.7 0.378 16.0 0.825 1.65 ``` ``` [1] NA ``` ] --- count: false ### 잔차는 정규분포? .panel1-sales_qqplot-auto[ ```r sales_model %>% broom::augment() %>% arrange(.std.resid) %>% * mutate(expected = qnorm((1:n() - .5)/n())) NA ``` ] .panel2-sales_qqplot-auto[ ``` # A tibble: 9 × 9 매출 온도 .fitted .resid .hat .sigma .cooksd .std.resid expected <dbl> <dbl> <dbl> <dbl> <dbl> <dbl> <dbl> <dbl> <dbl> 1 150 80 177. -26.7 0.111 16.9 0.139 -1.49 -1.59 2 120 75 139. -18.8 0.128 18.8 0.0828 -1.06 -0.967 3 200 85 214. -14.5 0.128 19.5 0.0491 -0.819 -0.589 4 250 90 252. -2.33 0.178 20.5 0.00199 -0.136 -0.282 5 100 70 101 -1.00 0.178 20.5 0.000365 -0.0581 0 6 70 65 63.2 6.83 0.261 20.2 0.0310 0.419 0.282 7 300 95 290. 9.83 0.261 19.9 0.0643 0.603 0.589 8 350 100 328 22.0 0.378 17.0 0.656 1.47 0.967 9 50 60 25.3 24.7 0.378 16.0 0.825 1.65 1.59 ``` ``` [1] NA ``` ] --- count: false ### 잔차는 정규분포? .panel1-sales_qqplot-auto[ ```r sales_model %>% broom::augment() %>% arrange(.std.resid) %>% mutate(expected = qnorm((1:n() - .5)/n())) %>% * ggplot() NA ``` ] .panel2-sales_qqplot-auto[ <!-- --> ``` [1] NA ``` ] --- count: false ### 잔차는 정규분포? .panel1-sales_qqplot-auto[ ```r sales_model %>% broom::augment() %>% arrange(.std.resid) %>% mutate(expected = qnorm((1:n() - .5)/n())) %>% ggplot() + * aes(y = .std.resid) NA ``` ] .panel2-sales_qqplot-auto[ <!-- --> ``` [1] NA ``` ] --- count: false ### 잔차는 정규분포? .panel1-sales_qqplot-auto[ ```r sales_model %>% broom::augment() %>% arrange(.std.resid) %>% mutate(expected = qnorm((1:n() - .5)/n())) %>% ggplot() + aes(y = .std.resid) + * aes(x = expected) NA ``` ] .panel2-sales_qqplot-auto[ <!-- --> ``` [1] NA ``` ] --- count: false ### 잔차는 정규분포? .panel1-sales_qqplot-auto[ ```r sales_model %>% broom::augment() %>% arrange(.std.resid) %>% mutate(expected = qnorm((1:n() - .5)/n())) %>% ggplot() + aes(y = .std.resid) + aes(x = expected) + * geom_rug() NA ``` ] .panel2-sales_qqplot-auto[ <!-- --> ``` [1] NA ``` ] --- count: false ### 잔차는 정규분포? .panel1-sales_qqplot-auto[ ```r sales_model %>% broom::augment() %>% arrange(.std.resid) %>% mutate(expected = qnorm((1:n() - .5)/n())) %>% ggplot() + aes(y = .std.resid) + aes(x = expected) + geom_rug() + * geom_point() NA ``` ] .panel2-sales_qqplot-auto[ 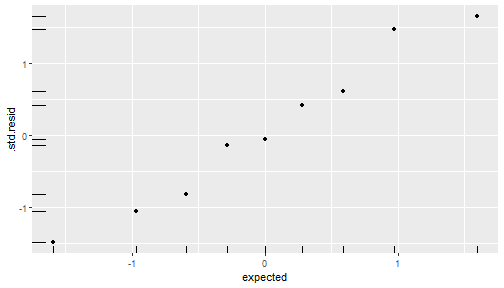<!-- --> ``` [1] NA ``` ] --- count: false ### 잔차는 정규분포? .panel1-sales_qqplot-auto[ ```r sales_model %>% broom::augment() %>% arrange(.std.resid) %>% mutate(expected = qnorm((1:n() - .5)/n())) %>% ggplot() + aes(y = .std.resid) + aes(x = expected) + geom_rug() + geom_point() + * coord_equal(ratio = 1, * xlim = c(-4, 4), * ylim = c(-4, 4)) NA ``` ] .panel2-sales_qqplot-auto[ 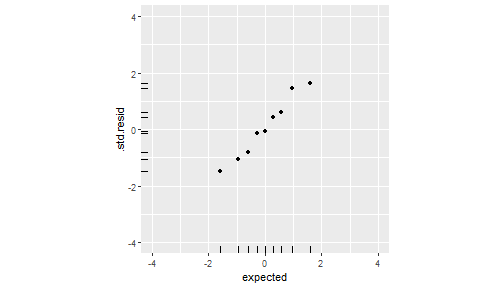<!-- --> ``` [1] NA ``` ] --- count: false ### 잔차는 정규분포? .panel1-sales_qqplot-auto[ ```r sales_model %>% broom::augment() %>% arrange(.std.resid) %>% mutate(expected = qnorm((1:n() - .5)/n())) %>% ggplot() + aes(y = .std.resid) + aes(x = expected) + geom_rug() + geom_point() + coord_equal(ratio = 1, xlim = c(-4, 4), ylim = c(-4, 4)) + # add line of equivilance * geom_abline(intercept = 0, * slope = 1, * linetype = "dotted") NA ``` ] .panel2-sales_qqplot-auto[ 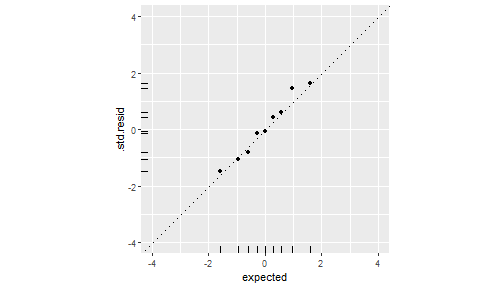<!-- --> ``` [1] NA ``` ] --- count: false ### 잔차는 정규분포? .panel1-sales_qqplot-auto[ ```r sales_model %>% broom::augment() %>% arrange(.std.resid) %>% mutate(expected = qnorm((1:n() - .5)/n())) %>% ggplot() + aes(y = .std.resid) + aes(x = expected) + geom_rug() + geom_point() + coord_equal(ratio = 1, xlim = c(-4, 4), ylim = c(-4, 4)) + # add line of equivilance geom_abline(intercept = 0, slope = 1, linetype = "dotted") + * labs(title = "정규 QQ플롯") NA ``` ] .panel2-sales_qqplot-auto[ 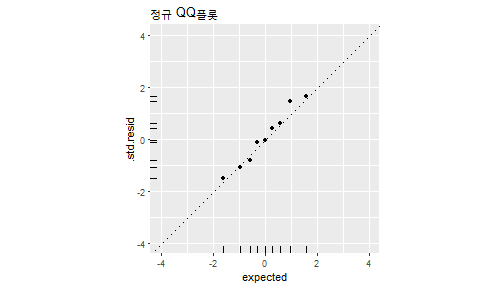<!-- --> ``` [1] NA ``` ] <style> .panel1-sales_qqplot-auto { color: black; width: 38.6060606060606%; hight: 32%; float: left; padding-left: 1%; font-size: 80% } .panel2-sales_qqplot-auto { color: black; width: 59.3939393939394%; hight: 32%; float: left; padding-left: 1%; font-size: 80% } .panel3-sales_qqplot-auto { color: black; width: NA%; hight: 33%; float: left; padding-left: 1%; font-size: 80% } </style>