class: center, middle, inverse, title-slide .title[ # 통계학 ] .subtitle[ ## 시각화 - 그래프 문법 ] .author[ ### 이광춘 ] --- <style type="text/css"> .remark-code{line-height: 1.5; font-size: 100%} @media print { .has-continuation { display: block; } } code.r.hljs.remark-code{ position: relative; overflow-x: hidden; } code.r.hljs.remark-code:hover{ overflow-x:visible; width: 500px; border-style: solid; } </style> # 데이터셋 .pull-left[ ```r library(tidyverse) library(gapminder) ``` ] .pull-right[ ``` # A tibble: 1,704 × 6 country continent year lifeExp pop gdpPercap <fct> <fct> <int> <dbl> <int> <dbl> 1 Afghanistan Asia 1952 28.8 8425333 779. 2 Afghanistan Asia 1957 30.3 9240934 821. 3 Afghanistan Asia 1962 32.0 10267083 853. 4 Afghanistan Asia 1967 34.0 11537966 836. 5 Afghanistan Asia 1972 36.1 13079460 740. 6 Afghanistan Asia 1977 38.4 14880372 786. 7 Afghanistan Asia 1982 39.9 12881816 978. 8 Afghanistan Asia 1987 40.8 13867957 852. 9 Afghanistan Asia 1992 41.7 16317921 649. 10 Afghanistan Asia 1997 41.8 22227415 635. # … with 1,694 more rows ``` ] --- count: false ### 그래프 문법 사례 .panel1-ggplot_viz-auto[ ```r *gapminder::gapminder ``` ] .panel2-ggplot_viz-auto[ ``` # A tibble: 1,704 × 6 country continent year lifeExp pop gdpPercap <fct> <fct> <int> <dbl> <int> <dbl> 1 Afghanistan Asia 1952 28.8 8425333 779. 2 Afghanistan Asia 1957 30.3 9240934 821. 3 Afghanistan Asia 1962 32.0 10267083 853. 4 Afghanistan Asia 1967 34.0 11537966 836. 5 Afghanistan Asia 1972 36.1 13079460 740. 6 Afghanistan Asia 1977 38.4 14880372 786. 7 Afghanistan Asia 1982 39.9 12881816 978. 8 Afghanistan Asia 1987 40.8 13867957 852. 9 Afghanistan Asia 1992 41.7 16317921 649. 10 Afghanistan Asia 1997 41.8 22227415 635. # … with 1,694 more rows ``` ] --- count: false ### 그래프 문법 사례 .panel1-ggplot_viz-auto[ ```r gapminder::gapminder %>% * filter(year == 2002) ``` ] .panel2-ggplot_viz-auto[ ``` # A tibble: 142 × 6 country continent year lifeExp pop gdpPercap <fct> <fct> <int> <dbl> <int> <dbl> 1 Afghanistan Asia 2002 42.1 25268405 727. 2 Albania Europe 2002 75.7 3508512 4604. 3 Algeria Africa 2002 71.0 31287142 5288. 4 Angola Africa 2002 41.0 10866106 2773. 5 Argentina Americas 2002 74.3 38331121 8798. 6 Australia Oceania 2002 80.4 19546792 30688. 7 Austria Europe 2002 79.0 8148312 32418. 8 Bahrain Asia 2002 74.8 656397 23404. 9 Bangladesh Asia 2002 62.0 135656790 1136. 10 Belgium Europe 2002 78.3 10311970 30486. # … with 132 more rows ``` ] --- count: false ### 그래프 문법 사례 .panel1-ggplot_viz-auto[ ```r gapminder::gapminder %>% filter(year == 2002) %>% * ggplot() ``` ] .panel2-ggplot_viz-auto[ <!-- --> ] --- count: false ### 그래프 문법 사례 .panel1-ggplot_viz-auto[ ```r gapminder::gapminder %>% filter(year == 2002) %>% ggplot() + * aes(x = gdpPercap) ``` ] .panel2-ggplot_viz-auto[ <!-- --> ] --- count: false ### 그래프 문법 사례 .panel1-ggplot_viz-auto[ ```r gapminder::gapminder %>% filter(year == 2002) %>% ggplot() + aes(x = gdpPercap) + * aes(y = lifeExp) ``` ] .panel2-ggplot_viz-auto[ <!-- --> ] --- count: false ### 그래프 문법 사례 .panel1-ggplot_viz-auto[ ```r gapminder::gapminder %>% filter(year == 2002) %>% ggplot() + aes(x = gdpPercap) + aes(y = lifeExp) + * geom_point() ``` ] .panel2-ggplot_viz-auto[ 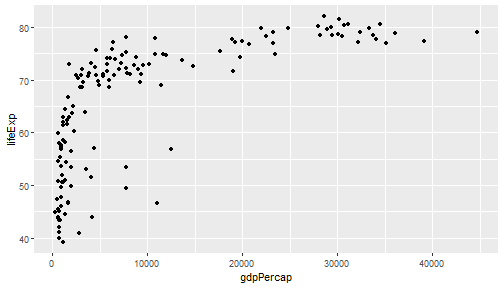<!-- --> ] --- count: false ### 그래프 문법 사례 .panel1-ggplot_viz-auto[ ```r gapminder::gapminder %>% filter(year == 2002) %>% ggplot() + aes(x = gdpPercap) + aes(y = lifeExp) + geom_point() + * aes(color = continent) ``` ] .panel2-ggplot_viz-auto[ 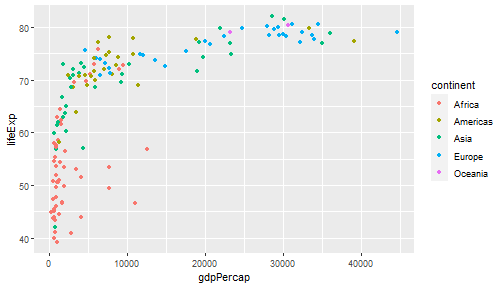<!-- --> ] --- count: false ### 그래프 문법 사례 .panel1-ggplot_viz-auto[ ```r gapminder::gapminder %>% filter(year == 2002) %>% ggplot() + aes(x = gdpPercap) + aes(y = lifeExp) + geom_point() + aes(color = continent) + * aes(size = pop/1000000) ``` ] .panel2-ggplot_viz-auto[ 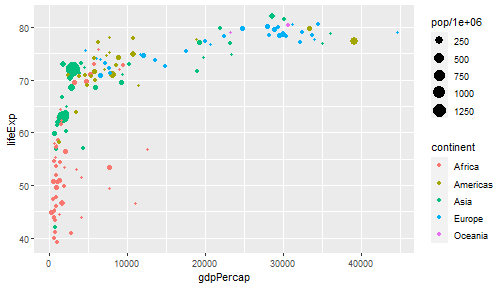<!-- --> ] --- count: false ### 그래프 문법 사례 .panel1-ggplot_viz-auto[ ```r gapminder::gapminder %>% filter(year == 2002) %>% ggplot() + aes(x = gdpPercap) + aes(y = lifeExp) + geom_point() + aes(color = continent) + aes(size = pop/1000000) + * labs(size = "인구수\n(백만명)") ``` ] .panel2-ggplot_viz-auto[ 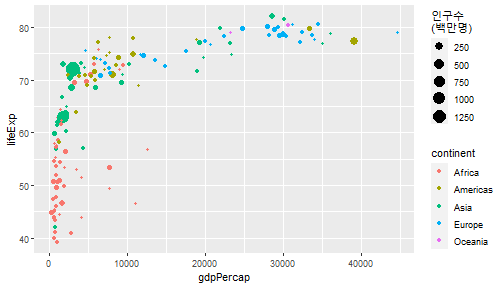<!-- --> ] --- count: false ### 그래프 문법 사례 .panel1-ggplot_viz-auto[ ```r gapminder::gapminder %>% filter(year == 2002) %>% ggplot() + aes(x = gdpPercap) + aes(y = lifeExp) + geom_point() + aes(color = continent) + aes(size = pop/1000000) + labs(size = "인구수\n(백만명)") + * labs(color = NULL) ``` ] .panel2-ggplot_viz-auto[ 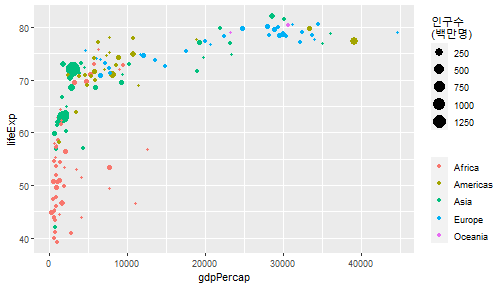<!-- --> ] --- count: false ### 그래프 문법 사례 .panel1-ggplot_viz-auto[ ```r gapminder::gapminder %>% filter(year == 2002) %>% ggplot() + aes(x = gdpPercap) + aes(y = lifeExp) + geom_point() + aes(color = continent) + aes(size = pop/1000000) + labs(size = "인구수\n(백만명)") + labs(color = NULL) + * labs(x = "1인당 GDP (미국 달러)") ``` ] .panel2-ggplot_viz-auto[ 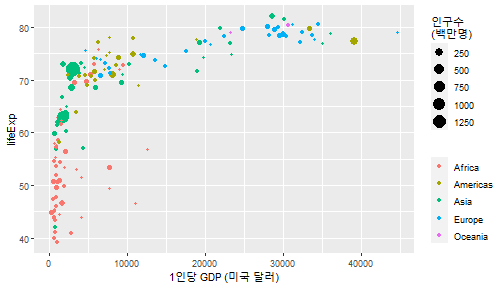<!-- --> ] --- count: false ### 그래프 문법 사례 .panel1-ggplot_viz-auto[ ```r gapminder::gapminder %>% filter(year == 2002) %>% ggplot() + aes(x = gdpPercap) + aes(y = lifeExp) + geom_point() + aes(color = continent) + aes(size = pop/1000000) + labs(size = "인구수\n(백만명)") + labs(color = NULL) + labs(x = "1인당 GDP (미국 달러)") + * labs(y = "기대수명 (연)") ``` ] .panel2-ggplot_viz-auto[ 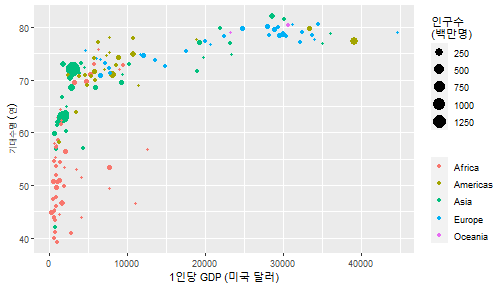<!-- --> ] --- count: false ### 그래프 문법 사례 .panel1-ggplot_viz-auto[ ```r gapminder::gapminder %>% filter(year == 2002) %>% ggplot() + aes(x = gdpPercap) + aes(y = lifeExp) + geom_point() + aes(color = continent) + aes(size = pop/1000000) + labs(size = "인구수\n(백만명)") + labs(color = NULL) + labs(x = "1인당 GDP (미국 달러)") + labs(y = "기대수명 (연)") + * labs(title = "2022년 기준 기대수명과 1인당 GDP") ``` ] .panel2-ggplot_viz-auto[ 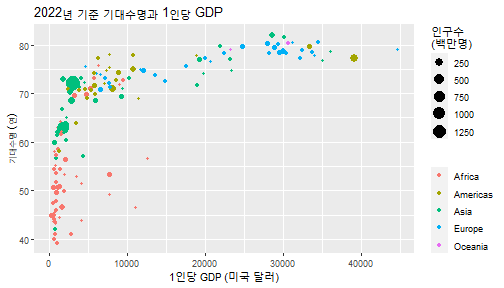<!-- --> ] --- count: false ### 그래프 문법 사례 .panel1-ggplot_viz-auto[ ```r gapminder::gapminder %>% filter(year == 2002) %>% ggplot() + aes(x = gdpPercap) + aes(y = lifeExp) + geom_point() + aes(color = continent) + aes(size = pop/1000000) + labs(size = "인구수\n(백만명)") + labs(color = NULL) + labs(x = "1인당 GDP (미국 달러)") + labs(y = "기대수명 (연)") + labs(title = "2022년 기준 기대수명과 1인당 GDP") + * labs(subtitle = "데이터출처: gapminder 데이터패키지") ``` ] .panel2-ggplot_viz-auto[ 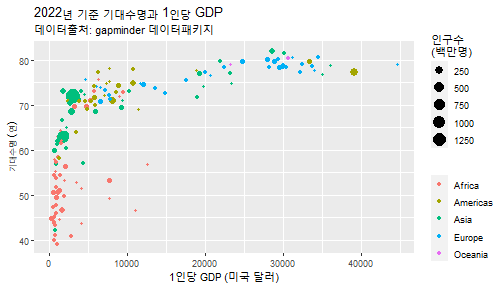<!-- --> ] --- count: false ### 그래프 문법 사례 .panel1-ggplot_viz-auto[ ```r gapminder::gapminder %>% filter(year == 2002) %>% ggplot() + aes(x = gdpPercap) + aes(y = lifeExp) + geom_point() + aes(color = continent) + aes(size = pop/1000000) + labs(size = "인구수\n(백만명)") + labs(color = NULL) + labs(x = "1인당 GDP (미국 달러)") + labs(y = "기대수명 (연)") + labs(title = "2022년 기준 기대수명과 1인당 GDP") + labs(subtitle = "데이터출처: gapminder 데이터패키지") + * labs(caption = "flipbookr 패키지 저자 학습코드") ``` ] .panel2-ggplot_viz-auto[ 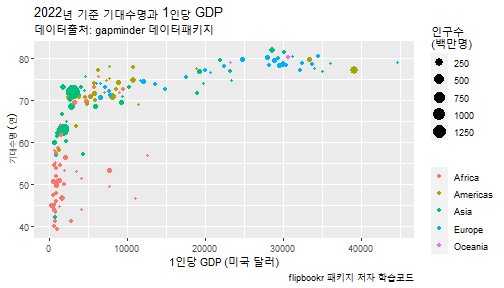<!-- --> ] --- count: false ### 그래프 문법 사례 .panel1-ggplot_viz-auto[ ```r gapminder::gapminder %>% filter(year == 2002) %>% ggplot() + aes(x = gdpPercap) + aes(y = lifeExp) + geom_point() + aes(color = continent) + aes(size = pop/1000000) + labs(size = "인구수\n(백만명)") + labs(color = NULL) + labs(x = "1인당 GDP (미국 달러)") + labs(y = "기대수명 (연)") + labs(title = "2022년 기준 기대수명과 1인당 GDP") + labs(subtitle = "데이터출처: gapminder 데이터패키지") + labs(caption = "flipbookr 패키지 저자 학습코드") + * facet_wrap(~ continent) ``` ] .panel2-ggplot_viz-auto[ 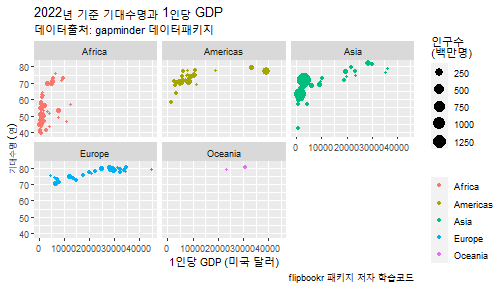<!-- --> ] <style> .panel1-ggplot_viz-auto { color: black; width: 38.6060606060606%; hight: 32%; float: left; padding-left: 1%; font-size: 80% } .panel2-ggplot_viz-auto { color: black; width: 59.3939393939394%; hight: 32%; float: left; padding-left: 1%; font-size: 80% } .panel3-ggplot_viz-auto { color: black; width: NA%; hight: 33%; float: left; padding-left: 1%; font-size: 80% } </style> --- count: false ### 데이터 조작 후 시각화 .panel1-wrangle-auto[ ```r *gapminder ``` ] .panel2-wrangle-auto[ ``` # A tibble: 1,704 × 6 country continent year lifeExp pop gdpPercap <fct> <fct> <int> <dbl> <int> <dbl> 1 Afghanistan Asia 1952 28.8 8425333 779. 2 Afghanistan Asia 1957 30.3 9240934 821. 3 Afghanistan Asia 1962 32.0 10267083 853. 4 Afghanistan Asia 1967 34.0 11537966 836. 5 Afghanistan Asia 1972 36.1 13079460 740. 6 Afghanistan Asia 1977 38.4 14880372 786. 7 Afghanistan Asia 1982 39.9 12881816 978. 8 Afghanistan Asia 1987 40.8 13867957 852. 9 Afghanistan Asia 1992 41.7 16317921 649. 10 Afghanistan Asia 1997 41.8 22227415 635. # … with 1,694 more rows ``` ] --- count: false ### 데이터 조작 후 시각화 .panel1-wrangle-auto[ ```r gapminder %>% * filter(year == 2002) ``` ] .panel2-wrangle-auto[ ``` # A tibble: 142 × 6 country continent year lifeExp pop gdpPercap <fct> <fct> <int> <dbl> <int> <dbl> 1 Afghanistan Asia 2002 42.1 25268405 727. 2 Albania Europe 2002 75.7 3508512 4604. 3 Algeria Africa 2002 71.0 31287142 5288. 4 Angola Africa 2002 41.0 10866106 2773. 5 Argentina Americas 2002 74.3 38331121 8798. 6 Australia Oceania 2002 80.4 19546792 30688. 7 Austria Europe 2002 79.0 8148312 32418. 8 Bahrain Asia 2002 74.8 656397 23404. 9 Bangladesh Asia 2002 62.0 135656790 1136. 10 Belgium Europe 2002 78.3 10311970 30486. # … with 132 more rows ``` ] --- count: false ### 데이터 조작 후 시각화 .panel1-wrangle-auto[ ```r gapminder %>% filter(year == 2002) %>% * filter(continent == "Europe") ``` ] .panel2-wrangle-auto[ ``` # A tibble: 30 × 6 country continent year lifeExp pop gdpPercap <fct> <fct> <int> <dbl> <int> <dbl> 1 Albania Europe 2002 75.7 3508512 4604. 2 Austria Europe 2002 79.0 8148312 32418. 3 Belgium Europe 2002 78.3 10311970 30486. 4 Bosnia and Herzegovina Europe 2002 74.1 4165416 6019. 5 Bulgaria Europe 2002 72.1 7661799 7697. 6 Croatia Europe 2002 74.9 4481020 11628. 7 Czech Republic Europe 2002 75.5 10256295 17596. 8 Denmark Europe 2002 77.2 5374693 32167. 9 Finland Europe 2002 78.4 5193039 28205. 10 France Europe 2002 79.6 59925035 28926. # … with 20 more rows ``` ] --- count: false ### 데이터 조작 후 시각화 .panel1-wrangle-auto[ ```r gapminder %>% filter(year == 2002) %>% filter(continent == "Europe") %>% * select(-lifeExp) ``` ] .panel2-wrangle-auto[ ``` # A tibble: 30 × 5 country continent year pop gdpPercap <fct> <fct> <int> <int> <dbl> 1 Albania Europe 2002 3508512 4604. 2 Austria Europe 2002 8148312 32418. 3 Belgium Europe 2002 10311970 30486. 4 Bosnia and Herzegovina Europe 2002 4165416 6019. 5 Bulgaria Europe 2002 7661799 7697. 6 Croatia Europe 2002 4481020 11628. 7 Czech Republic Europe 2002 10256295 17596. 8 Denmark Europe 2002 5374693 32167. 9 Finland Europe 2002 5193039 28205. 10 France Europe 2002 59925035 28926. # … with 20 more rows ``` ] --- count: false ### 데이터 조작 후 시각화 .panel1-wrangle-auto[ ```r gapminder %>% filter(year == 2002) %>% filter(continent == "Europe") %>% select(-lifeExp) %>% * rename(population = pop) ``` ] .panel2-wrangle-auto[ ``` # A tibble: 30 × 5 country continent year population gdpPercap <fct> <fct> <int> <int> <dbl> 1 Albania Europe 2002 3508512 4604. 2 Austria Europe 2002 8148312 32418. 3 Belgium Europe 2002 10311970 30486. 4 Bosnia and Herzegovina Europe 2002 4165416 6019. 5 Bulgaria Europe 2002 7661799 7697. 6 Croatia Europe 2002 4481020 11628. 7 Czech Republic Europe 2002 10256295 17596. 8 Denmark Europe 2002 5374693 32167. 9 Finland Europe 2002 5193039 28205. 10 France Europe 2002 59925035 28926. # … with 20 more rows ``` ] --- count: false ### 데이터 조작 후 시각화 .panel1-wrangle-auto[ ```r gapminder %>% filter(year == 2002) %>% filter(continent == "Europe") %>% select(-lifeExp) %>% rename(population = pop) %>% * mutate(gdp_billions = gdpPercap * population / 10^8) ``` ] .panel2-wrangle-auto[ ``` # A tibble: 30 × 6 country continent year population gdpPercap gdp_billions <fct> <fct> <int> <int> <dbl> <dbl> 1 Albania Europe 2002 3508512 4604. 162. 2 Austria Europe 2002 8148312 32418. 2641. 3 Belgium Europe 2002 10311970 30486. 3144. 4 Bosnia and Herzegovina Europe 2002 4165416 6019. 251. 5 Bulgaria Europe 2002 7661799 7697. 590. 6 Croatia Europe 2002 4481020 11628. 521. 7 Czech Republic Europe 2002 10256295 17596. 1805. 8 Denmark Europe 2002 5374693 32167. 1729. 9 Finland Europe 2002 5193039 28205. 1465. 10 France Europe 2002 59925035 28926. 17334. # … with 20 more rows ``` ] --- count: false ### 데이터 조작 후 시각화 .panel1-wrangle-auto[ ```r gapminder %>% filter(year == 2002) %>% filter(continent == "Europe") %>% select(-lifeExp) %>% rename(population = pop) %>% mutate(gdp_billions = gdpPercap * population / 10^8) %>% * arrange(gdp_billions) ``` ] .panel2-wrangle-auto[ ``` # A tibble: 30 × 6 country continent year population gdpPercap gdp_billions <fct> <fct> <int> <int> <dbl> <dbl> 1 Montenegro Europe 2002 720230 6557. 47.2 2 Iceland Europe 2002 288030 31163. 89.8 3 Albania Europe 2002 3508512 4604. 162. 4 Bosnia and Herzegovina Europe 2002 4165416 6019. 251. 5 Slovenia Europe 2002 2011497 20660. 416. 6 Croatia Europe 2002 4481020 11628. 521. 7 Bulgaria Europe 2002 7661799 7697. 590. 8 Serbia Europe 2002 10111559 7236. 732. 9 Slovak Republic Europe 2002 5410052 13639. 738. 10 Ireland Europe 2002 3879155 34077. 1322. # … with 20 more rows ``` ] --- count: false ### 데이터 조작 후 시각화 .panel1-wrangle-auto[ ```r gapminder %>% filter(year == 2002) %>% filter(continent == "Europe") %>% select(-lifeExp) %>% rename(population = pop) %>% mutate(gdp_billions = gdpPercap * population / 10^8) %>% arrange(gdp_billions) %>% * mutate(country = * fct_reorder(country, gdp_billions)) -> europe_2002 ``` ] .panel2-wrangle-auto[ ] --- count: false ### 데이터 조작 후 시각화 .panel1-wrangle-auto[ ```r gapminder %>% filter(year == 2002) %>% filter(continent == "Europe") %>% select(-lifeExp) %>% rename(population = pop) %>% mutate(gdp_billions = gdpPercap * population / 10^8) %>% arrange(gdp_billions) %>% mutate(country = fct_reorder(country, gdp_billions)) -> europe_2002 *europe_2002 %>% ggplot() ``` ] .panel2-wrangle-auto[ <!-- --> ] --- count: false ### 데이터 조작 후 시각화 .panel1-wrangle-auto[ ```r gapminder %>% filter(year == 2002) %>% filter(continent == "Europe") %>% select(-lifeExp) %>% rename(population = pop) %>% mutate(gdp_billions = gdpPercap * population / 10^8) %>% arrange(gdp_billions) %>% mutate(country = fct_reorder(country, gdp_billions)) -> europe_2002 europe_2002 %>% ggplot() + * aes(x = gdp_billions) ``` ] .panel2-wrangle-auto[ <!-- --> ] --- count: false ### 데이터 조작 후 시각화 .panel1-wrangle-auto[ ```r gapminder %>% filter(year == 2002) %>% filter(continent == "Europe") %>% select(-lifeExp) %>% rename(population = pop) %>% mutate(gdp_billions = gdpPercap * population / 10^8) %>% arrange(gdp_billions) %>% mutate(country = fct_reorder(country, gdp_billions)) -> europe_2002 europe_2002 %>% ggplot() + aes(x = gdp_billions) + * aes(y = country) ``` ] .panel2-wrangle-auto[ <!-- --> ] --- count: false ### 데이터 조작 후 시각화 .panel1-wrangle-auto[ ```r gapminder %>% filter(year == 2002) %>% filter(continent == "Europe") %>% select(-lifeExp) %>% rename(population = pop) %>% mutate(gdp_billions = gdpPercap * population / 10^8) %>% arrange(gdp_billions) %>% mutate(country = fct_reorder(country, gdp_billions)) -> europe_2002 europe_2002 %>% ggplot() + aes(x = gdp_billions) + aes(y = country) + * geom_col() ``` ] .panel2-wrangle-auto[ 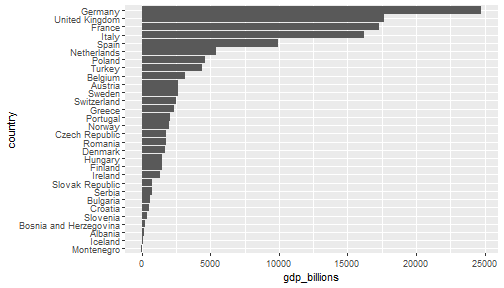<!-- --> ] --- count: false ### 데이터 조작 후 시각화 .panel1-wrangle-auto[ ```r gapminder %>% filter(year == 2002) %>% filter(continent == "Europe") %>% select(-lifeExp) %>% rename(population = pop) %>% mutate(gdp_billions = gdpPercap * population / 10^8) %>% arrange(gdp_billions) %>% mutate(country = fct_reorder(country, gdp_billions)) -> europe_2002 europe_2002 %>% ggplot() + aes(x = gdp_billions) + aes(y = country) + geom_col() + * labs(y = NULL, x = "US$ Billions", title = "2002년 유럽소재 국가 GDP ") ``` ] .panel2-wrangle-auto[ 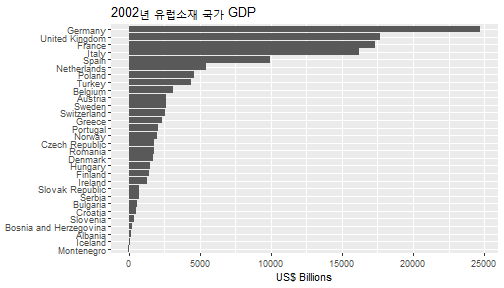<!-- --> ] --- count: false ### 데이터 조작 후 시각화 .panel1-wrangle-auto[ ```r gapminder %>% filter(year == 2002) %>% filter(continent == "Europe") %>% select(-lifeExp) %>% rename(population = pop) %>% mutate(gdp_billions = gdpPercap * population / 10^8) %>% arrange(gdp_billions) %>% mutate(country = fct_reorder(country, gdp_billions)) -> europe_2002 europe_2002 %>% ggplot() + aes(x = gdp_billions) + aes(y = country) + geom_col() + labs(y = NULL, x = "US$ Billions", title = "2002년 유럽소재 국가 GDP ") + * labs(subtitle = "데이터출처: gapminder 데이터패키지") ``` ] .panel2-wrangle-auto[ 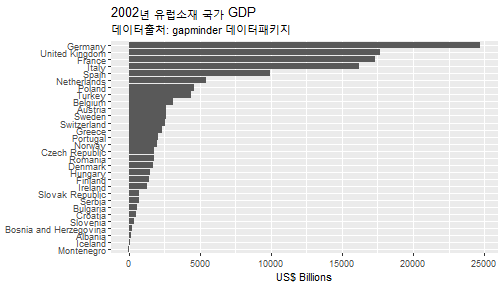<!-- --> ] --- count: false ### 데이터 조작 후 시각화 .panel1-wrangle-auto[ ```r gapminder %>% filter(year == 2002) %>% filter(continent == "Europe") %>% select(-lifeExp) %>% rename(population = pop) %>% mutate(gdp_billions = gdpPercap * population / 10^8) %>% arrange(gdp_billions) %>% mutate(country = fct_reorder(country, gdp_billions)) -> europe_2002 europe_2002 %>% ggplot() + aes(x = gdp_billions) + aes(y = country) + geom_col() + labs(y = NULL, x = "US$ Billions", title = "2002년 유럽소재 국가 GDP ") + labs(subtitle = "데이터출처: gapminder 데이터패키지") + * labs(caption = "flipbookr 저자 Dr. Reynolds") ``` ] .panel2-wrangle-auto[ 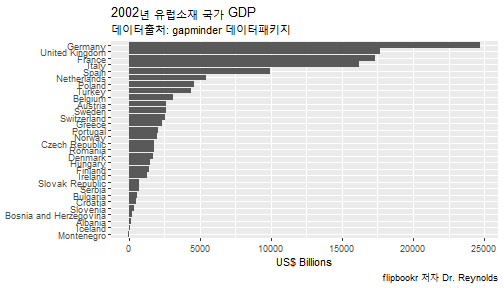<!-- --> ] --- count: false ### 데이터 조작 후 시각화 .panel1-wrangle-auto[ ```r gapminder %>% filter(year == 2002) %>% filter(continent == "Europe") %>% select(-lifeExp) %>% rename(population = pop) %>% mutate(gdp_billions = gdpPercap * population / 10^8) %>% arrange(gdp_billions) %>% mutate(country = fct_reorder(country, gdp_billions)) -> europe_2002 europe_2002 %>% ggplot() + aes(x = gdp_billions) + aes(y = country) + geom_col() + labs(y = NULL, x = "US$ Billions", title = "2002년 유럽소재 국가 GDP ") + labs(subtitle = "데이터출처: gapminder 데이터패키지") + labs(caption = "flipbookr 저자 Dr. Reynolds") + * theme_minimal(base_size = 10) ``` ] .panel2-wrangle-auto[ 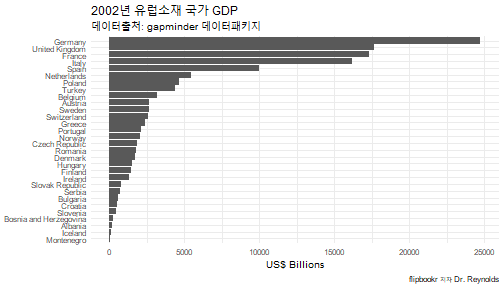<!-- --> ] <style> .panel1-wrangle-auto { color: black; width: 38.6060606060606%; hight: 32%; float: left; padding-left: 1%; font-size: 80% } .panel2-wrangle-auto { color: black; width: 59.3939393939394%; hight: 32%; float: left; padding-left: 1%; font-size: 80% } .panel3-wrangle-auto { color: black; width: NA%; hight: 33%; float: left; padding-left: 1%; font-size: 80% } </style>